Lost in Stories: Consistency Bugs in Long Story Generation by LLMs
Source: converted from arXiv LaTeX source papers_md/2603.05890_lost_in_stories/source/acl_latex.tex.
Abstract
What happens when a storyteller forgets its own story? Large Language Models (LLMs) can now generate narratives spanning tens of thousands of words, but they often fail to maintain consistency throughout. When generating long-form narratives, these models can contradict their own established facts, character traits, and world rules. Existing story generation benchmarks focus mainly on plot quality and fluency, leaving consistency errors largely unexplored. To address this gap, we present ConStory-Bench, a benchmark designed to evaluate narrative consistency in long-form story generation. It contains 2,000 prompts across four task scenarios and defines a taxonomy of five error categories with 19 fine-grained subtypes. We also develop ConStory-Checker, an automated pipeline that detects contradictions and grounds each judgment in explicit textual evidence. Evaluating a range of LLMs through five research questions, we find that consistency errors show clear tendencies: they are most common in factual and temporal dimensions, tend to appear around the middle of narratives, occur in text segments with higher token-level entropy, and certain error types tend to co-occur. These findings can inform future efforts to improve consistency in long-form narrative generation. Our project page is available at https://picrew.github.io/constory-bench.github.io/.
Introduction
Long-form narrative generation has become a key capability for large language models (LLMs) empowering a wide range of applications including, e.g. content creation, storytelling, and educational authoring. As context windows expand, models must maintain consistency across thousands of tokens by accurately tracking entities and events, preserving world rules, and sustaining coherent stylistic conventions, rather than merely producing locally fluent text. Recent research has advanced long-context understanding and long-form generation capabilities, yet these efforts have not systematically isolated cross-context contradictions or provided reproducible evaluation mechanisms at scale [bai2024longbench,bai2025longbench,an2024eval,wu2024longgenbench,que2024hellobench]. Within narrative generation, existing planning-based approaches [zhou2023recurrentgpt,wang2023improving,xie2024creating,gurung2024chiron,wen2023grove] and creative writing evaluations [ismayilzada2024evaluating,xie2023next,wang2024weaver] focus primarily on plot coherence and fluency, leaving global consistency underexplored. Furthermore, while LLM-as-a-judge protocols show promise for automated evaluation, existing approaches typically lack explicit textual evidence and interpretable rationales [lee2024checkeval,pereira2024check,tan2024proxyqa,chen2024humans,zheng2023judging].
To fill this gap, we present ConStory-Bench, a benchmark for evaluating narrative consistency in long-form story generation. We also develop ConStory-Checker, an automated evaluation pipeline that detects contradictions and grounds each judgment in explicit textual evidence with exact quotations. ConStory-Bench comprises 2,000 prompts across four narrative task scenarios and defines a five-dimension taxonomy with 19 fine-grained error subtypes. An overview of the benchmark and pipeline is provided in Figure fig:overview.
Figure fig:overview: Overview of ConStory-Bench. The framework comprises three components: (a) a 2,000-prompt benchmark for long story generation (Targeting 8,000--10,000 words), (b) ConStory-Checker, a three-stage pipeline that extracts errors across five categories, pairs contradictions, and constructs evidence chains, and (c) standardized scoring via Consistency Error Density (CED) and Group Relative Rank (GRR).
We structure our investigation around the following Research Questions: (1) To what extent do current LLMs maintain narrative coherence in ultra-long text generation, and do different models exhibit similar distributions of consistency error types? (2) How do consistency errors scale as a function of output length across different LLM architectures? (3) What underlying factors contribute to the emergence of consistency errors, and are there identifiable signals that reliably predict their occurrence? (4) Do different types of consistency errors systematically co-occur, or do they arise independently? (5) How are consistency errors distributed across positions within long-form generated narratives?
Our main contributions are as follows: itemize We introduce ConStory-Bench, a benchmark for evaluating narrative consistency in long-form story generation, with four task scenarios and a taxonomy of five error categories and 19 fine-grained subtypes. We develop ConStory-Checker, an automated evaluation pipeline that detects contradictions and supports each judgment with exact textual evidence. We present evaluation results for a broad range of text generation systems, spanning proprietary and open-source models, capability-enhanced models, and agentic generation systems, and conduct a systematic analysis guided by five research questions. itemize
ConStory-Bench
We present ConStory-Bench, a benchmark for evaluating consistency in long-form narrative generation. The benchmark uses an LLM-as-judge pipeline to detect consistency errors and classify them into fine-grained categories. Section sec:construction describes the data collection and prompt construction procedure, Section sec:error-taxonomy introduces the error taxonomy, and Section sec:detection-pipeline presents the automated evaluation pipeline.
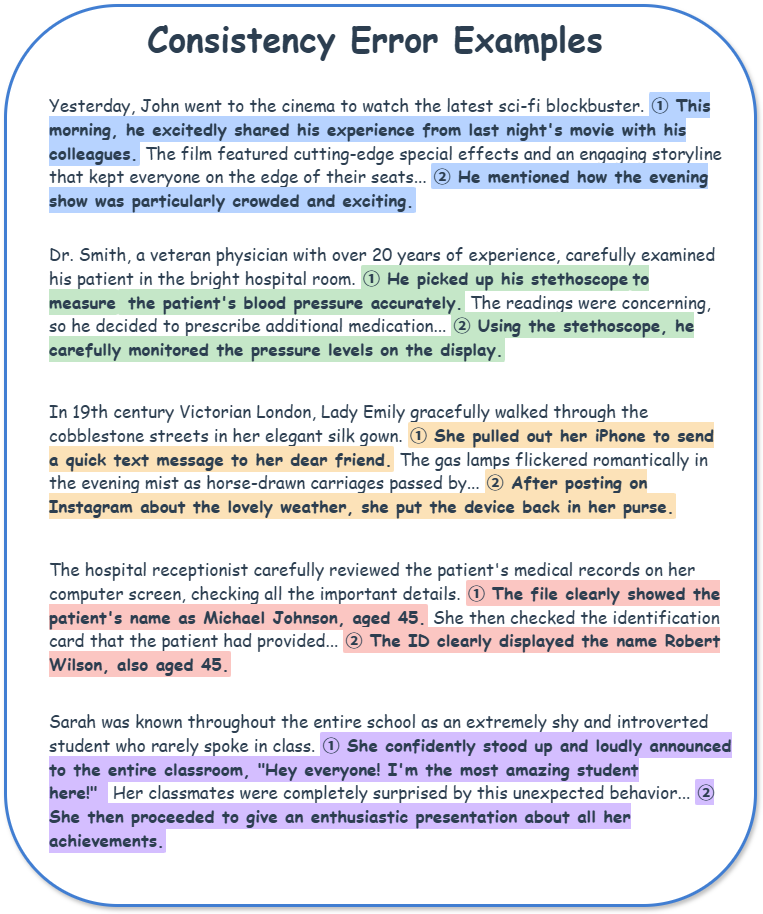
Figure fig:consistency-error-examples: Representative consistency error examples sampled from real LLM-generated stories on ConStory-Bench. Highlighted segments show contradictions in 41,128,185Timeline & Plot Logic, 39,174,96Characterization, 241,196,15World-building & Setting, 230,126,34Factual & Detail Consistency, and 155,89,182Narrative & Style.
Dataset Construction
Sources and Selection.
We collect seed stories from seven diverse public corpora: LongBench [bai2024longbench], LongBench_Write [bai2024longwriter], LongLamp [kumar2024longlamp], TellMeAStory [akoury2020storium], WritingBench [wu2025writingbench], WritingPrompts [fan2018hierarchical], and WikiPlots [riedl-2017-wikiplots]. We extract both creative writing queries and full-length narratives from these corpora.
Prompt Construction via LLM Rewriting.
We convert the collected stories into task-specific prompts to elicit long-form narrative generation from models. For each story, we first assign one of four task types based on its narrative structure and content: generation - produce a free-form narrative given only a minimal plot setup, continuation - extend an initial story fragment into a complete, coherent narrative, expansion - develop a long-form story from a concise yet relatively complete plot outline by elaborating implicit details and events, completion - write a full story with predefined beginning and ending, given minimal guidance for the intervening plot. Using o4-mini, we then rewrite each story into a prompt tailored to its assigned task type, grounding prompts in authentic narrative elements from the source stories while constraining target generation length to 8,000--10,000 words. Finally, we perform quality control through: (i) MinHash-based deduplication to remove near-duplicate prompts, and (ii) filtering low-quality or trivial cases through manual inspection and automated heuristics. This process yields 2,000 high-quality prompts distributed across the four task types (Table tab:dataset-statistics). Detailed task specifications and representative prompt examples are provided in Appendix sec:benchmark-construction.
Table tab:dataset-statistics: Statistics of ConStory-Bench across four task types.
\begin{table}[t!]
\centering
\small
\begingroup
\renewcommand{1.15}{1.35}
\begin{tabular}{lcc}
\toprule
\textbf{Task Type} & \textbf{Count} & \textbf{Percentage} \\
\midrule
Generation   & 751  & 37.5\% \\
Continuation & 432  & 21.6\% \\
Expansion    & 422  & 21.1\% \\
Completion   & 395  & 19.8\% \\
\midrule
\textbf{Total} & \textbf{2,000} & \textbf{100\%} \\
\bottomrule
\end{tabular}
\endgroup
\caption{Statistics of ConStory-Bench across four task types.}
\label{tab:dataset-statistics}
\end{table}
Consistency Error Taxonomy
To enable systematic evaluation, we develop a hierarchical taxonomy grounded in narrative theory and prior research on story understanding [ismayilzada2024evaluating,xie2023next]. The taxonomy comprises five top-level categories and 19 fine-grained error types (Table tab:error-taxonomy), encompassing contradictions that emerge across temporal logic, character memory, world-building rules, factual details, and narrative style. Representative error cases with detailed annotations are presented in Figure fig:consistency-error-examples.
Table tab:error-taxonomy: Consistency-error taxonomy used by ConStory-Bench, comprising five categories and 19 subtypes.
\begin{table}[t!]
\centering
\small
\setlength{\tabcolsep}{8pt}
\renewcommand{1.15}{1.2}
\begin{tabular}{p{3cm}@{\hspace{1em}}l}
\toprule
\textbf{Error Type} & \textbf{Sub Error Type} \\
\midrule
 \rowcolor{blue!10}
\textbf{Timeline \& Plot} & Absolute Time Contradictions \\
 \rowcolor{blue!10}
\textbf{Logic} & Duration Contradictions \\
 \rowcolor{blue!10}
 & Simultaneity Contradictions \\
 \rowcolor{blue!10}
 & Causeless Effects \\
 \rowcolor{blue!10}
 & Causal Logic Violations \\
 \rowcolor{blue!10}
 & Abandoned Plot Elements \\
 \rowcolor{green!10}
\textbf{Characterization} & Memory Contradictions \\
 \rowcolor{green!10}
 & Knowledge Contradictions \\
 \rowcolor{green!10}
 & Skill Fluctuations \\
 \rowcolor{green!10}
 & Forgotten Abilities \\
 \rowcolor{yellow!10}
\textbf{World-building \&} & Core Rules Violations \\
 \rowcolor{yellow!10}
\textbf{Setting} & Social Norms Violations \\
 \rowcolor{yellow!10}
 & Geographical Contradictions \\
 \rowcolor{orange!10}
\textbf{Factual \& Detail} & Appearance Mismatches \\
 \rowcolor{orange!10}
\textbf{Consistency} & Nomenclature Confusions \\
 \rowcolor{orange!10}
 & Quantitative Mismatches \\
 \rowcolor{purple!10}
\textbf{Narrative \& Style} & Perspective Confusions \\
 \rowcolor{purple!10}
 & Tone Inconsistencies \\
 \rowcolor{purple!10}
 & Style Shifts \\
 \bottomrule
\end{tabular}
\caption{Consistency-error taxonomy used by ConStory-Bench, comprising five categories and 19 subtypes.}
\label{tab:error-taxonomy}
\end{table}
Automated Error Detection Pipeline
Building on the task structure and error taxonomy, we introduce ConStory-Checker, an automated LLM-as-judge pipeline for scalable and auditable consistency evaluation. The pipeline consists of four stages [zheng2023judging]:
Stage 1: Category-Guided Extraction.
Narratives are scanned using category-specific prompts across five dimensions (Timeline/Plot, Characterization, World-building, Factual, Narrative Style) to extract contradiction-prone spans.
Stage 2: Contradiction Pairing.
Extracted spans are compared pairwise and classified as Consistent or Contradictory, following CheckEval [lee2024checkeval] and ProxyQA [tan2024proxyqa]. This reduces false positives and isolates genuine inconsistencies.
Stage 3: Evidence Chains.
For each contradiction, we record: Reasoning (why it is a contradiction), Evidence (quoted text with positions), and Conclusion (error type) [pereira2024check].
Stage 4: JSON Reports.
Standardized JSON outputs capture quotations, positions, pairings, error categories, and explanations, with all judgments anchored to precise character-level offsets.
We adopt o4-mini as the evaluation model to balance accuracy and efficiency; recent studies confirm strong LLM performance on structured judgment tasks [chen2024humans]. Complete implementation details are provided in Appendix sec:storyverify-details. This four-stage pipeline forms the foundation for the experiments in Section sec:evaluation.
Evaluation
We evaluate narrative consistency across four types of systems—proprietary models, open-source models, capability-enhanced models, and agentic writing systems—using ConStory-Bench and ConStory-Checker.
Experimental Setup
Models and Data.
We evaluate a comprehensive set of models spanning four categories. Proprietary models are from OpenAI [gpt5], Google [comanici2025gemini], Anthropic [anthropic2025claude45], xAI [xai2025grok4] and others. Open-source models cover Qwen [qwen3], DeepSeek [deepseekr1], GLM [glm], Kimi [kimik2], and others. We also include capability-enhanced models fine-tuned for long-form story generation [wu2025longwriter, pham2024suri, bai2024longalign] and agent-enhanced systems [wu2025superwriter, wang2025generating] that employ multi-step generation pipelines. Each model generates outputs for all 2,000 prompts across the four task scenarios (Figure fig:task-prompts) under comparable settings.
Results and Analysis
mplBlueRQ1
To what extent do current LLMs maintain narrative coherence in ultra-long text generation, and do different models exhibit similar distributions of consistency error types?*
Benchmarking long-form narrative consistency requires metrics that capture both absolute error rates and relative performance across diverse prompts, yet naive error counting fails to account for length variation and prompt difficulty.
Method.
We employ two complementary metrics to address these challenges, building on established methodologies for ranking-based evaluation [liu2023gevalnlgevaluationusing, zheng2023judging]. Simply counting errors per story unfairly penalizes models that generate longer outputs---a 10K-word story intuitively would have more opportunities for errors than a 2K-word one. To remove this length bias, we introduce Consistency Error Density (CED), which normalizes errors by output length, measuring errors per ten thousand words for model \(m\) on story \(i\) :
where \(e_{m,i}\) denotes error count and \(w_{m,i}\) word count. Model-level scores average over all stories: \(\overline{\text{CED}}_m = \frac{1}{N}\sum_{i=1}^{N}\text{CED}_{m,i}\) (lower is better). However, CED still does not account for varying prompt difficulty: some prompts inherently elicit more errors across all models. To enable fair cross-model comparison that controls for instance-level difficulty, we introduce Group Relative Rank (GRR), which ranks models within each prompt group. For each story \(i\) with \(M_i\) candidate outputs, we define a length-aware quality score
rank all models by \(Q_{m,i}\) within the same story \(i\) , and compute GRR:
Detailed computation examples illustrating these metrics are provided in Appendix sec:example-calculation.
Results & Answer.
Table tab:comprehensive-performance shows substantial performance variation across the evaluated models. GPT-5-Reasoning achieves the lowest CED (0.113) and best GRR (2.80), followed by Gemini-2.5-Pro (CED: 0.305) and Claude-Sonnet-4.5 (CED: 0.520, GRR: 4.54). Among open-source models, GLM-4.6 and Qwen3-32B exhibit competitive performance (CED: 0.528--0.537), approaching proprietary-level consistency; moreover, capability-enhanced LongWriter-Zero (CED: 0.669) and agent-enhanced SuperWriter (CED: 0.674) achieve comparable results despite different generation strategies. These benchmarks show that most models still struggle with long-form narrative consistency and make a considerable number of errors, while GPT-5-Reasoning currently delivers the strongest performance among all evaluated systems. Practically, error analysis reveals Factual & Detail Consistency and Timeline & Plot Logic as dominant failure modes, indicating entity tracking and temporal reasoning remain primary challenges. Beyond model-level comparisons, task type also affects consistency: Generation tasks consistently yield higher CED than Continuation, Expansion, and Completion tasks across most models (Table tab:task-type-ced), suggesting that open-ended creation without prior context poses the greatest consistency challenge. A comprehensive performance ranking is provided in Appendix sec:leaderboard.
Table* tab:comprehensive-performance: Comprehensive performance on ConStory-Bench. CED: Consistency Error Density (errors per 10K words; lower is better). Category columns show CED breakdown: Char. (Characterization), Fact. (Factual & Detail Consistency), Narr. (Narrative & Style), Time. (Timeline & Plot Logic), World (World-building & Setting). GRR: Group Relative Rank (lower is better). Words: average output length (words). Errors: average error count per story. Total: number of completed stories. .741,.843,.933Blue indicates the best model in each column, .886,.937,.855Green indicates the second best, and 1,.949,.8Yellow indicates the third best. Models with Total below 2,000 indicate prompts refused due to safety filtering.
\begin{table*}[t!]
\centering
\small
\caption{Comprehensive performance on ConStory-Bench. \textbf{CED}: Consistency Error Density (errors per 10K words; lower is better). Category columns show CED breakdown: \textbf{Char.} (Characterization), \textbf{Fact.} (Factual \& Detail Consistency), \textbf{Narr.} (Narrative \& Style), \textbf{Time.} (Timeline \& Plot Logic), \textbf{World} (World-building \& Setting). \textbf{GRR}: Group Relative Rank (lower is better). \textbf{Words}: average output length (words). \textbf{Errors}: average error count per story. \textbf{Total}: number of completed stories. \colorbox[rgb]{.741,.843,.933}{\textbf{Blue}} indicates the best model in each column, \colorbox[rgb]{.886,.937,.855}{Green} indicates the second best, and \colorbox[rgb]{1,.949,.8}{Yellow} indicates the third best. Models with Total below 2,000 indicate prompts refused due to safety filtering.}
\label{tab:comprehensive-performance}
\setlength{\tabcolsep}{2.5pt}
\renewcommand{1.15}{1.2}
\resizebox{\textwidth}{!}{
\begin{tabular}{l|c ccccc|c|>{\centering\arraybackslash}p{1.2cm}>{\centering\arraybackslash}p{1.2cm}>{\centering\arraybackslash}p{1.2cm}}
\toprule
\multirow{2}{*}{\textbf{Model}} & \multicolumn{6}{c|}{\textbf{CED (errors per 10K words) $\downarrow$}} & \multirow{2}{*}{\textbf{GRR $\downarrow$}} & \multirow{2}{*}{\textbf{Words}} & \multirow{2}{*}{\textbf{Errors}} & \multirow{2}{*}{\textbf{Total}} \\
\cmidrule(lr){2-7}
& \textbf{Overall} & \textbf{Char.} & \textbf{Fact.} & \textbf{Narr.} & \textbf{Time.} & \textbf{World} & & & & \\
\midrule
\multicolumn{11}{c}{\cellcolor[gray]{0.9}\textit{Proprietary Models}} \\
\midrule
GPT-5-Reasoning & \cellcolor[rgb]{.741,.843,.933}\textbf{0.113} & \cellcolor[rgb]{.741,.843,.933}\textbf{0.005} & \cellcolor[rgb]{.741,.843,.933}\textbf{0.061} & \cellcolor[rgb]{.886,.937,.855}0.003 & \cellcolor[rgb]{.741,.843,.933}\textbf{0.024} & \cellcolor[rgb]{.741,.843,.933}\textbf{0.003} & \cellcolor[rgb]{.741,.843,.933}\textbf{3.05} & 9050 & 0.09 & 1990 \\
Gemini-2.5-Pro & \cellcolor[rgb]{.886,.937,.855}0.305 & \cellcolor[rgb]{.886,.937,.855}0.009 & 0.132 & 0.015 & \cellcolor[rgb]{1,.949,.8}0.108 & \cellcolor[rgb]{.886,.937,.855}0.029 & 7.79 & 5584 & 0.16 & 1996 \\
Claude-Sonnet-4.5 & \cellcolor[rgb]{1,.949,.8}0.520 & 0.017 & 0.224 & \cellcolor[rgb]{1,.949,.8}0.004 & 0.128 & 0.043 & \cellcolor[rgb]{.886,.937,.855}4.9 & 8929 & 0.37 & 1998 \\
Grok-4 & 0.670 & 0.033 & 0.307 & 0.065 & 0.222 & 0.076 & 13.38 & 2765 & 0.19 & 2000 \\
GPT-4o-1120 & 0.711 & 0.036 & 0.163 & 0.018 & 0.440 & 0.104 & 17.59 & 1241 & 0.09 & 1774 \\
Doubao-1.6-Thinking-2507 & 1.217 & 0.070 & 0.407 & 0.035 & 0.355 & 0.160 & 11.9 & 3713 & 0.41 & 2000 \\
Mistral-Medium-3.1 & 1.355 & 0.067 & 0.435 & 0.010 & 0.474 & 0.155 & 14.67 & 2447 & 0.28 & 2000 \\
\midrule
\multicolumn{11}{c}{\cellcolor[gray]{0.9}\textit{Open-source Models}} \\
\midrule
GLM-4.6 & 0.528 & 0.015 & 0.184 & 0.007 & \cellcolor[rgb]{.886,.937,.855}0.102 & 0.051 & 8.45 & 4949 & 0.18 & 2000 \\
Qwen3-32B & 0.537 & \cellcolor[rgb]{1,.949,.8}0.009 & \cellcolor[rgb]{1,.949,.8}0.120 & 0.068 & 0.191 & 0.047 & 6.39 & 6237 & 0.27 & 2000 \\
Ring-1T & 0.539 & 0.012 & 0.249 & 0.015 & 0.111 & 0.048 & 8.08 & 5264 & 0.23 & 1999 \\
DeepSeek-V3.2-Exp & 0.541 & 0.011 & 0.201 & 0.012 & 0.129 & 0.044 & 10.89 & 3724 & 0.15 & 2000 \\
Qwen3-235B-A22B-Thinking & 0.559 & 0.013 & 0.269 & 0.010 & 0.136 & 0.069 & 7.89 & 5424 & 0.27 & 2000 \\
Step3 & 0.845 & 0.017 & 0.330 & 0.116 & 0.189 & 0.061 & 11.45 & 3793 & 0.27 & 1916 \\
Kimi-K2-2509 & 1.300 & 0.016 & 0.630 & 0.007 & 0.311 & 0.099 & 13.32 & 3227 & 0.34 & 1792 \\
Nvidia-llama-3.1-Ultra & 1.833 & 0.045 & 0.376 & 0.045 & 0.793 & 0.151 & 17.82 & 1224 & 0.17 & 1998 \\
MiniMax-M1-80k & 3.447 & 0.133 & 1.079 & 0.004 & 1.050 & 0.376 & 18.07 & 1442 & 0.38 & 1716 \\
\midrule
\multicolumn{11}{c}{\cellcolor[gray]{0.9}\textit{Capability-enhanced LLMs}} \\
\midrule
LongWriter-Zero~{\scriptsize\cite{wu2025longwriter}} & 0.669 & 0.027 & \cellcolor[rgb]{.886,.937,.855}0.097 & 0.054 & 0.178 & 0.039 & \cellcolor[rgb]{1,.949,.8}5.45 & 13393 & 0.53 & 1857 \\
Suri-i-ORPO~{\scriptsize\cite{pham2024suri}} & 2.445 & 0.129 & 0.225 & 0.236 & 0.689 & 0.122 & 12.76 & 4279 & 0.60 & 2000 \\
LongAlign-13B-64k~{\scriptsize\cite{bai2024longalign}} & 3.664 & 0.099 & 1.720 & \cellcolor[rgb]{.741,.843,.933}\textbf{0.002} & 0.751 & 0.123 & 18.88 & 1624 & 0.20 & 2000 \\
\midrule
\multicolumn{11}{c}{\cellcolor[gray]{0.9}\textit{Agent-enhanced Systems}} \\
\midrule
SuperWriter~{\scriptsize\cite{wu2025superwriter}} & 0.674 & 0.025 & 0.255 & 0.070 & 0.245 & \cellcolor[rgb]{1,.949,.8}0.030 & 7.97 & 6036 & 0.38 & 2000 \\
DOME~{\scriptsize\cite{wang2025generating}} & 1.033 & 0.037 & 0.591 & 0.018 & 0.288 & 0.068 & 6.94 & 8399 & 0.84 & 1969 \\
\bottomrule
\end{tabular}
}
\end{table*}
mplOrangeRQ2
How do consistency errors scale as a function of output length across different LLM architectures?*
To assess long-form narrative generation, we need to understand how consistency behaves as the generated text grows. In practice, models that prefer shorter outputs may appear more consistent but leave storylines unfinished, whereas models that write longer texts may complete narratives yet accumulate more contradictions. To study these patterns, we analyze output length distributions across the evaluated models and examine how error counts scale with increasing narrative length.
Results & Answer.
Figure fig:length-distribution reveals highly diverse length preferences across evaluated models. Proprietary systems like GPT-5-Reasoning and Claude-Sonnet-4.5 predominantly produce outputs exceeding 6K words (90.6% and 90.7% respectively), while Grok-4 and GPT-4o-1120 predominantly generate shorter outputs, with the majority concentrated in 0--3K words (70.2% and 100% respectively). Open-source models exhibit varied preferences: Qwen3-32B favors longer outputs (92.0% beyond 3K words), whereas DeepSeek-V3.2-Exp balances across ranges. As shown in Figure fig:length-error-correlation, error counts increase approximately linearly with output length across models. Claude-Sonnet-4.5 exhibits moderate length-error correlation (r=0.478), while DeepSeek-V3.2-Exp shows stronger dependency (r=0.973). These patterns demonstrate that errors accumulate linearly with length; however, models differ substantially in their length preferences, leading to diverse length-consistency patterns. Additional model output length statistics are provided in Appendix sec:length-statistics.
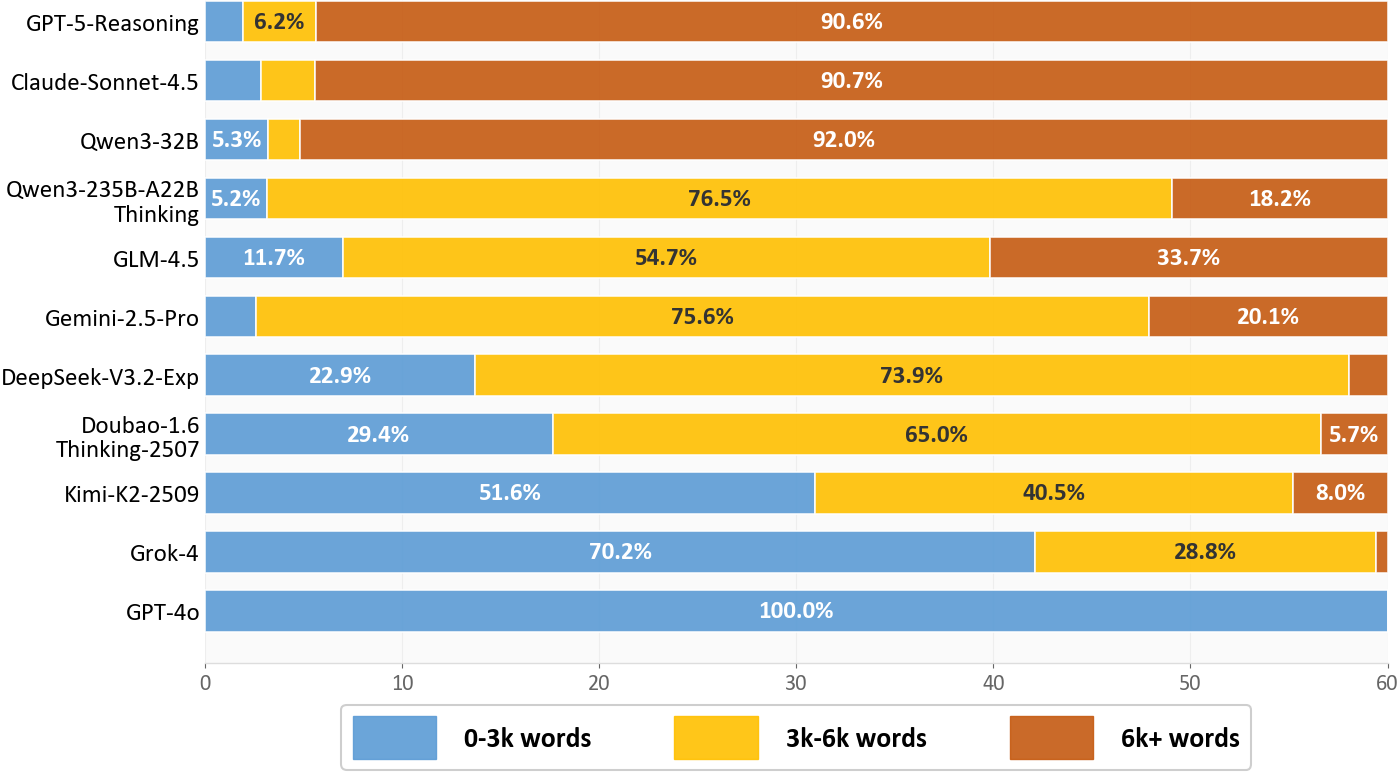
Figure fig:length-distribution: Output length distribution across representative models. Stacked bars show the proportion of 0--3K, 3K--6K, and 6K+ word outputs.
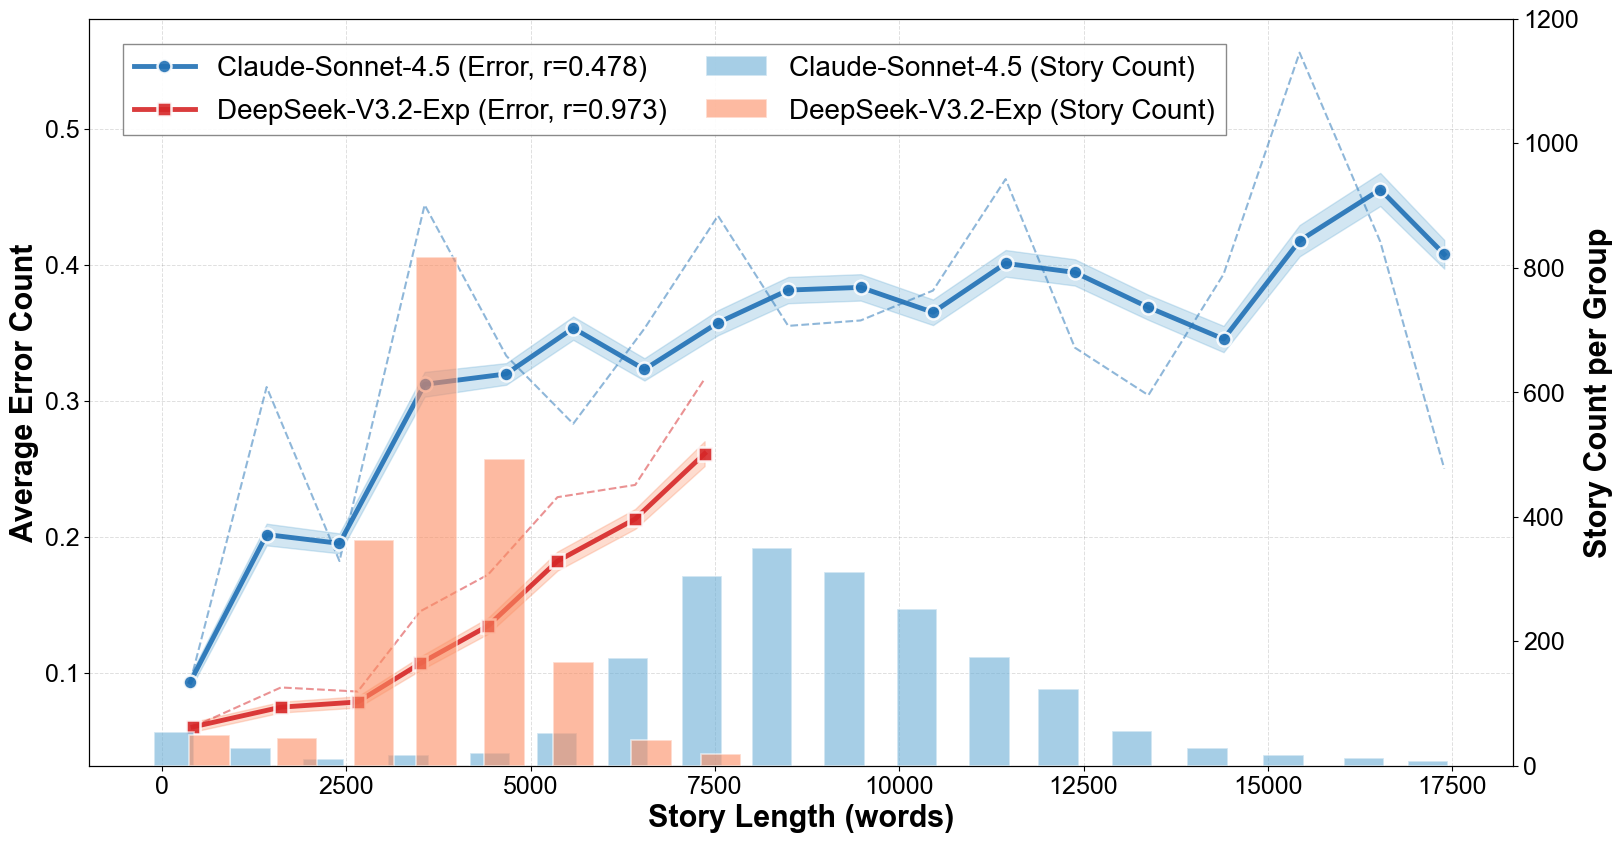
Figure fig:length-error-correlation: Consistency error growth across different story lengths for two models. Lines: Average error count per story at each length bin (cf.\ ``Errors'' in Table tab:comprehensive-performance); Bars: Number of samples in each bin.
mplPurpleRQ3
What underlying factors contribute to the emergence of consistency errors, and are there identifiable signals that reliably predict their occurrence?*
Method.
We examine whether model uncertainty differs between erroneous and correct content. We quantify token-level uncertainty using Shannon entropy [wang2025beyond, khalid2025ergo, krishnan2024enhancing, lee2025uncertainty]. We select two models, Qwen3-4B-Instruct-2507 (4B) and Qwen3-30B-A3B-Instruct-2507 (30B), because they are open-source and reproducible, have adequate error samples, and impose manageable computational costs for entropy calculation over long contexts. For each position \(t\) in a generated sequence, let \(P_t=\{p_1,p_2,\ldots,p_K\}\) denote the next-token distribution over the top- \(K\) candidates; then
where higher entropy signifies a more diffuse, less confident distribution. For a text segment \(S\) with \(N\) tokens, we report the sentence-level mean [ H(S)=1N_t=1^N H(P_t). ] All entropy measurements are based on decoding configurations commonly used in practice: Temperature = 0.7, Top- \(k\) = 20, and Top- \(p\) = 0.95. We compute \(\bar{H}\) for error content and the whole-text baseline across representative models.
Results & Answer.
Across two representative models, error content exhibits consistently and significantly higher entropy than the whole-text baseline: Qwen3-4B-Instruct-2507 shows an entropy increase of 19.24%, while Qwen3-30B-A3B-Instruct-2507 shows an increase of 12.03% (Table tab:entropy-comparison). Taken together, these results indicate that the model does not err unknowingly; rather, it more often makes incorrect choices when confronted with greater uncertainty. Practically, this makes entropy an actionable early-warning signal: when local entropy surpasses a stability threshold, the system should trigger verification or self-check routines to curb consistency failures proactively. For complementary token-level uncertainty measures (e.g., probability, perplexity), see Appendix sec:token-uncertainty.
Table tab:entropy-comparison: Entropy comparison between whole text and error-bearing segments. Higher entropy in error content indicates greater unpredictability relative to the whole-text baseline.
\begin{table}[t!]
\centering
\small
\setlength{\tabcolsep}{4pt}
\renewcommand{1.15}{1.2}
\caption{Entropy comparison between whole text and error-bearing segments. Higher entropy in error content indicates greater unpredictability relative to the whole-text baseline.}
\label{tab:entropy-comparison}
\resizebox{\columnwidth}{!}{
\begin{tabular}{lcc}
\toprule
\textbf{Metric} & \textbf{Qwen3-30B-A3B} & \textbf{Qwen3-4B} \\
 & \textbf{Instruct-2507} & \textbf{Instruct-2507} \\
\midrule
Whole Text Avg Entropy & 1.1438 & 1.0734 \\
Error Content Avg Entropy & 1.2814 & 1.2799 \\
\midrule
Error vs Whole (\% Diff) & \textbf{\textcolor{red!70!black}{+12.03\%}} & \textbf{\textcolor{red!70!black}{+19.24\%}} \\
\bottomrule
\end{tabular}
}
\end{table}
mplRedRQ4
Do different types of consistency errors systematically co-occur, or do they arise independently?*
Correlation patterns between error categories can reveal important relationships: if two error types often appear together, they may share a common cause; if they rarely co-occur, they likely arise independently. To quantify these patterns, we compute pairwise Pearson correlation coefficients among the five error categories across all model outputs.
Results & Answer.
Figure fig:error-correlation shows that Factual & Detail Consistency serves as a central hub, correlating most strongly with Characterization (r=0.304), World-building & Setting (r=0.255), and Timeline & Plot Logic (r=0.176). This heterogeneous correlation structure demonstrates that consistency failures do not arise uniformly; rather, they cluster along specific dependency chains. In contrast, Narrative & Style errors exhibit near-zero correlations with all other categories, indicating that stylistic inconsistencies arise through mechanisms distinct from factual or logical failures. The strong correlation between Factual & Detail Consistency and other categories suggests these errors tend to co-occur, likely sharing underlying failure mechanisms. Model-specific correlation patterns are provided in Appendix sec:model-error-correlations.
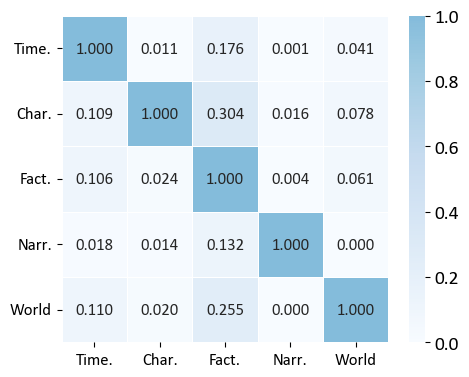
Figure fig:error-correlation: Correlation matrix of error categories across all model outputs. Higher values (darker blue) indicate stronger co-occurrence of error types.
mplGreenRQ5
How are consistency errors distributed across positions within long-form generated narratives?*
Locating where contradictions appear in the story helps us understand when models start to produce inconsistent content.
The distance between facts and contradictions matters: contradictions shortly after facts suggest local tracking failures, whereas large gaps indicate long-range coherence breakdowns. To quantify these patterns, we record three normalized positional metrics for each error instance: (1) the position where the original fact is first established (fact position), (2) the position where the contradiction appears (contradiction position), and (3) the distance between them (gap). The average gap is computed as \(\text{Avg Gap} = \frac{1}{n}\sum_{i=1}^{n}|\text{contra}_i - \text{fact}_i|\) . By design, earlier narrative content serves as the ground truth against which later content is evaluated for logical consistency.
Results & Answer.
As shown in Table tab:error-position, geographical contradictions exhibit the largest average positional gap (31.0%), followed by absolute-time contradictions (29.7%), while perspective confusions show minimal gaps (4.7%), suggesting these arise from local rather than long-range context failures. Figure fig:error-heatmaps visualizes these positional dynamics through dumbbell plots spanning four representative models. These spatial distributions demonstrate that errors are not uniformly distributed; rather, different error types emerge at characteristic positions along the narrative, with contradiction positions predominantly clustering in the 40--60% range. Across models, fact positions (blue) concentrate in the early-to-mid narrative (15--30%), while contradiction positions (red) extend toward later sections. GPT-5-Reasoning shows the widest gaps for absolute-time contradictions, whereas Qwen3-235B-A22B-Thinking exhibits more compressed gaps overall. Notably, perspective confusions display minimal gaps across all models, suggesting these errors arise from local rather than long-range context failures. Practically, the systematic gap patterns highlight that temporal and geographical errors require robust long-range memory mechanisms, while stylistic errors may be addressed through local consistency checks. Extended positional analysis across additional models is provided in Appendix sec:extended-positional.
Table* tab:error-position: Positional distribution of seven representative error subtypes. Positions are normalized by story length (0--100%).
\begin{table*}[t!]
\centering
\small
\setlength{\tabcolsep}{6pt}
\renewcommand{1.15}{1.25}
\caption{Positional distribution of seven representative error subtypes. Positions are normalized by story length (0--100\%).}
\label{tab:error-position}
\resizebox{\textwidth}{!}{
\begin{tabular}{lccccccc}
\toprule
\textbf{Metric} & \textbf{Absolute Time} & \textbf{Core Rules} & \textbf{Quantitative} & \textbf{Geographical} & \textbf{Nomenclature} & \textbf{Memory} & \textbf{Perspective} \\
 & \textbf{Contradictions} & \textbf{Violations} & \textbf{Mismatches} & \textbf{Contradictions} & \textbf{Confusions} & \textbf{Contradictions} & \textbf{Confusions} \\
\midrule
Avg Fact  & 22.6\% & 23.7\% & 23.4\% & 20.4\% & 21.6\% & 21.8\% & 13.7\% \\
Avg Contradiction & 48.9\% & 39.4\% & 40.6\% & 39.2\% & 34.4\% & 38.2\% & 12.2\% \\
Avg Gap    & 29.7\% & 23.4\% & 23.8\% & 31.0\% & 23.3\% & 25.4\% & 4.7\%  \\
\bottomrule
\end{tabular}
}
\end{table*}
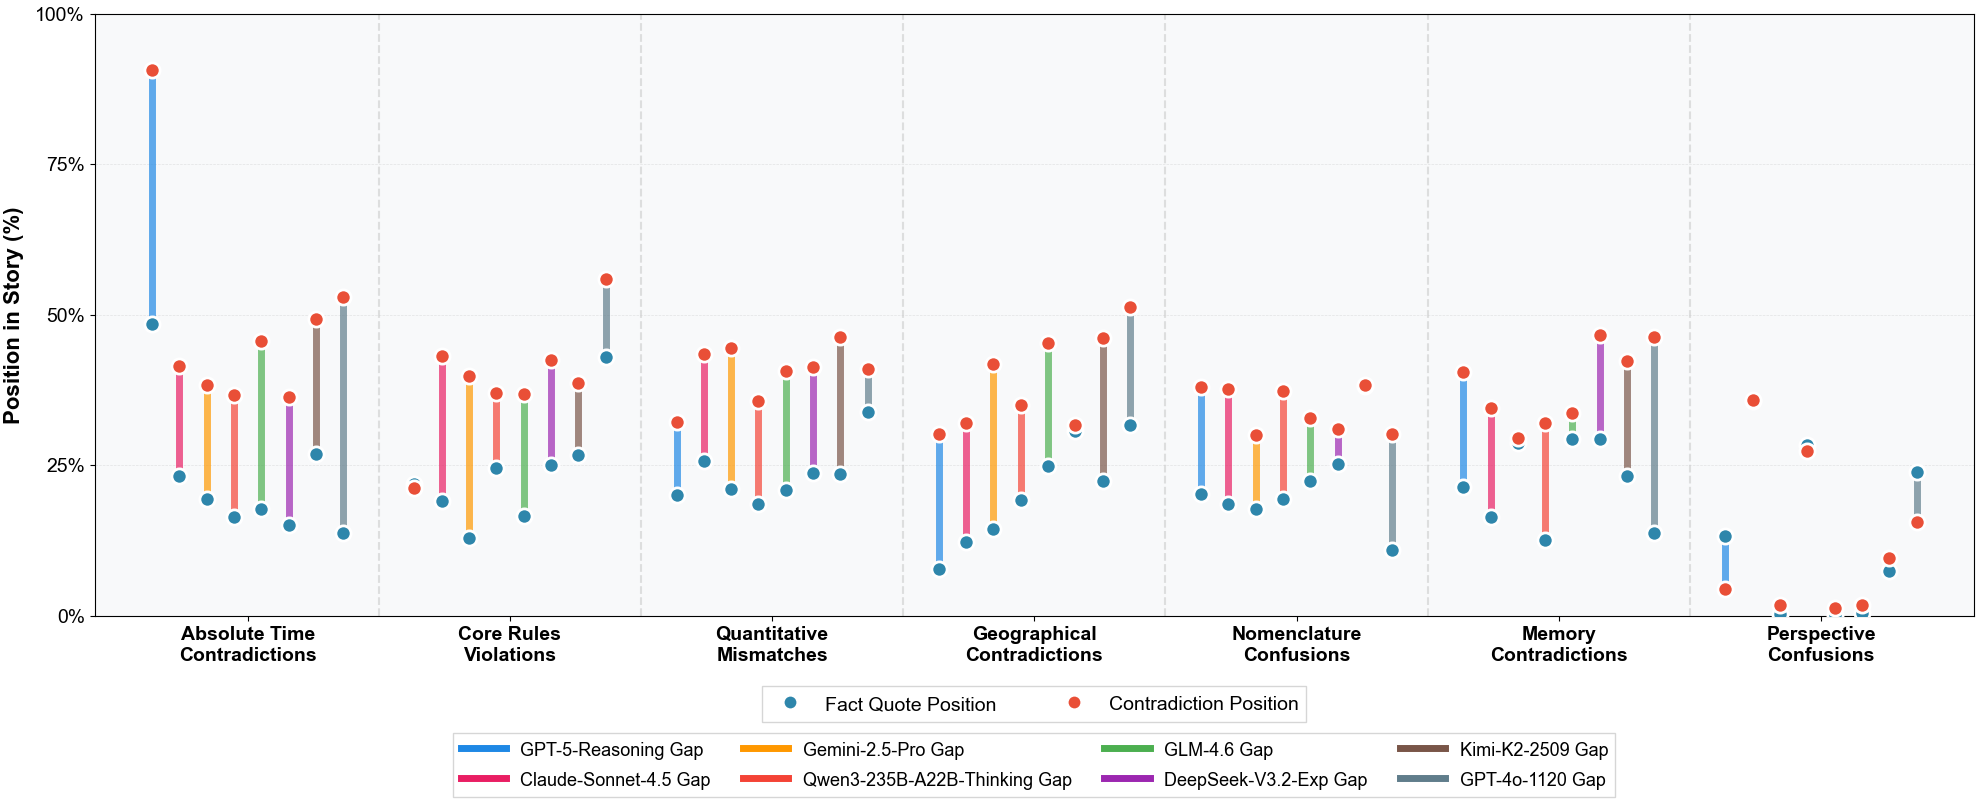
Figure fig:error-heatmaps: Dumbbell plot of error positional distributions. Each row represents an error subtype; blue dots show where facts are first established (fact position), red dots show where contradictions appear, and the connecting line indicates the gap. Columns show four representative models. Values are normalized by story length.
Related Work
Story Generation.* Narrative generation tests coherence across plot, characters, and timelines. Planning methods—iterative planning [xie2024creating], pacing control [wang2023improving], hierarchical outlines [wang2025generating], and recurrent mechanisms [zhou2023recurrentgpt]—improve structure; CHIRON [gurung2024chiron] finds character inconsistency. Multi-agent collaboration [huot2024agents] and retrieval-augmented generation [wen2023grove] improve grounding. Length extension methods [bai2024longwriter, pham2024suri, wu2025superwriter, tu2025longwriter] enable longer outputs, but coherence degrades with length [que2024hellobench, wu2024longgenbench].
Long-Form Generation Benchmarks.* As context windows expand, long-form evaluation becomes critical. Early work relied on perplexity [beltagy2020longformer, roy2021efficient, press2021train], which correlates poorly with real use. LongBench [bai2024longbench, bai2025longbench] provides long-context evaluation spanning 8K–2M tokens, while HelloBench [que2024hellobench] and WritingBench [wu2025writingbench] focus on generation quality; models struggle at 16K–32K tokens [wu2024longgenbench]. Classical metrics (ROUGE, BLEU, METEOR) correlate weakly with human judgments [que2024hellobench], so recent work adds checklist mechanisms [que2024hellobench, lee2024checkeval, pereira2024check], dynamic criteria [wu2025writingbench], and proxy-based evaluation [tan2024proxyqa]. Yet many benchmarks rely on fixed templates [paech2023eq, que2024hellobench, bai2025longbench], limiting fine-grained error detection. For stories, existing evaluations focus on holistic quality [ismayilzada2024evaluating, wang2024weaver, xie2023next] rather than systematic contradiction detection.
Conclusion
We presented ConStory-Bench, a benchmark, and ConStory-Checker, an evaluation pipeline, for assessing narrative consistency in long-form story generation. Our experiments show that current LLMs still produce systematic consistency errors, especially in factual tracking and temporal reasoning; moreover, these errors are not random but cluster in predictable narrative regions. We will provide an interactive portal where the community can discover and submit new consistency errors and checking techniques.
Limitations
We acknowledge several limitations of this work. First, our benchmark focuses on English fiction following Western narrative conventions. Different cultures have different expectations for storytelling, and we have not evaluated how well ConStory-Bench applies to narratives from other cultural or linguistic backgrounds. Second, we model consistency as a binary judgment—content is either consistent or contradictory. However, some apparent contradictions may serve intentional purposes, such as surprise endings or strategically delayed information; our approach does not distinguish these from true errors. Third, we focus on fiction and storytelling, while long-form consistency is also important in other domains such as technical documentation, academic writing, and screenplays, each with its own conventions.
These limitations suggest several directions for future work: extending the benchmark to multilingual and cross-cultural contexts, developing methods to recognize intentional ambiguity, and adapting the framework to evaluate consistency in other long-form genres.
0.70.7 0.90.9 0.80.8 0.10.1
Benchmark Construction
This appendix section details the construction methodology of ConStory-Bench, including task type design rationale, the ConStory-Checker evaluation pipeline, and additional experimental configurations.
Task Type Design Rationale
The four task types are designed to capture different aspects of narrative consistency challenges commonly encountered in long-form generation. Representative prompts for each task type are shown in Figure fig:task-prompts.
Generation involves producing free-form narratives from minimal plot setups, where consistent characters, rules, and causal chains must be instantiated without prior context.
Continuation extends initial story fragments into complete, coherent narratives while preserving established facts, timelines, and character states, ensuring new events remain causally compatible with the given context [zhou2023recurrentgpt].
Expansion develops long-form stories from concise yet relatively complete plot outlines by elaborating implicit details and events while maintaining global consistency as narrative complexity increases.
Completion writes full stories with predefined beginnings and endings, filling in the intervening plot to produce coherent and causally well-formed narratives, mirroring collaborative writing workflows.
Figure fig:task-prompts: Example prompts for the four narrative generation task types in ConStory-Bench.
ConStory-Checker: Detailed Implementation
Extending the conceptual framework presented in Section sec:detection-pipeline, this subsection provides comprehensive implementation details of the ConStory-Checker evaluation pipeline. While Section sec:detection-pipeline introduces the four-stage detection process, a complete specification of prompt structures, category taxonomies, and output schemas is essential for reproducible consistency evaluation at scale.
Category Definitions.
The ConStory-Checker pipeline evaluates narrative consistency through five complementary error dimensions (Figures fig:storyverify-timeline--fig:storyverify-narrative): Timeline & Plot Logic, Characterization, World-building & Setting, Factual & Detail Consistency, and Narrative & Style. Each category employs structured extraction guidelines with standardized JSON output schemas specifying fact_quote, location, contradiction_pair, error_element, error_category, and context fields, enabling systematic cross-document comparison and aggregation.
Validation Methodology.
To empirically validate ConStory-Checker's effectiveness, we constructed a diagnostic dataset through systematic error injection into authentic narrative contexts. Using Qwen3-235B-A22B-Thinking, we generated 200 stories with deliberately planted inconsistencies across all five error dimensions (1,000 injected errors total). Two professional web novel writers independently annotated this dataset at $1.00 per story, completing all 200 stories within two days and establishing human expert baselines for comparison. The annotation protocol required annotators to first study the five-category error taxonomy and subtype definitions, then read each story in full to identify consistency errors. For each error, they recorded: (1) the fact quote, (2) the contradicting quote, (3) the error category and subtype, and (4) a brief explanation of the inconsistency. We evaluated both ConStory-Checker (Direct Detection) and human annotators (Human Detection) using standard classification metrics---Precision, Recall, and F1-score---with the injected errors serving as ground truth.
Results.
Table tab:storyverify-performance and Figure fig:storyverify-performance present performance comparisons across all error categories. The results demonstrate that ConStory-Checker (Overall F1=0.678) substantially outperforms human expert judgment (Overall F1=0.281) in detecting narrative inconsistencies. The automated system achieves high precision (0.884) while maintaining robust recall (0.550), with particularly strong performance in Character Consistency (F1=0.742) and Factual Accuracy (F1=0.718). In contrast, human annotators exhibit substantially lower recall across all dimensions---ranging from 4.5% to 31.5%. Notably, ConStory-Checker detects 550 of 1,000 injected errors (55.0% recall) compared to only 171 detections by human experts (17.1% recall), representing a 3.2 \(\times\) improvement in error discovery rate. Figure fig:storyverify-examples illustrates representative detection cases, demonstrating ConStory-Checker's capability to identify subtle contradictions across all five dimensions. These findings validate that automated consistency evaluation provides more comprehensive and reliable detection of narrative consistency errors compared to manual human judgment.
Table* tab:storyverify-performance: Performance comparison between ConStory-Checker (Direct Detection) and human expert judgment (Human Detection) on the diagnostic dataset. GT (Ground Truth) indicates the 200 injected errors for each category. The error categories are: Char. (Characterization), Fact. (Factual & Detail Consistency), Narr. (Narrative & Style), Time. (Timeline & Plot Logic), and World (World-building & Setting).
\begin{table*}[!t]
\centering
\small
\caption{Performance comparison between \textsc{ConStory-Checker} (Direct Detection) and human expert judgment (Human Detection) on the diagnostic dataset. GT (Ground Truth) indicates the 200 injected errors for each category. The error categories are: \textbf{Char.} (Characterization), \textbf{Fact.} (Factual \& Detail Consistency), \textbf{Narr.} (Narrative \& Style), \textbf{Time.} (Timeline \& Plot Logic), and \textbf{World} (World-building \& Setting).}
\label{tab:storyverify-performance}
\setlength{\tabcolsep}{6pt}
\renewcommand{1.15}{1.1}
\begin{tabular}{lc|ccccc|ccccc}
\toprule
\multirow{2}{*}{\textbf{Error Category}} & \multirow{2}{*}{\textbf{GT}} & \multicolumn{5}{c|}{\textbf{Direct Detection}} & \multicolumn{5}{c}{\textbf{Experts Detection (Avg)}} \\
\cmidrule(lr){3-7} \cmidrule(lr){8-12}
& & \textbf{Pred} & \textbf{TP} & \textbf{Recall} & \textbf{Prec} & \textbf{F1} & \textbf{Pred} & \textbf{TP} & \textbf{Recall} & \textbf{Prec} & \textbf{F1} \\
\midrule
\textbf{Character Consistency} & 200 & 126 & 121 & 0.605 & 0.960 & 0.742 & 53.5 & 48.5 & 0.242 & 0.891 & 0.379 \\
\textbf{Factual Accuracy} & 200 & 148 & 125 & 0.625 & 0.845 & 0.718 & 16.5 & 13.5 & 0.068 & 0.841 & 0.124 \\
\textbf{Narrative Coherence} & 200 & 76  & 70  & 0.350 & 0.921 & 0.507 & 29.5 & 18.0 & 0.090 & 0.586 & 0.153 \\
\textbf{Temporal Logic} & 200 & 147 & 120 & 0.600 & 0.816 & 0.692 & 84.0 & 40.5 & 0.203 & 0.463 & 0.281 \\
\textbf{World Consistency} & 200 & 125 & 114 & 0.570 & 0.912 & 0.702 & 26.5 & 18.0 & 0.090 & 0.686 & 0.159 \\
\midrule
\textbf{Total} & \textbf{1000} & \textbf{622} & \textbf{550} & \textbf{0.550} & \textbf{0.884} & \textbf{0.678} & \textbf{210.0} & \textbf{138.5} & \textbf{0.139} & \textbf{0.660} & \textbf{0.229} \\
\bottomrule
\end{tabular}
\end{table*}
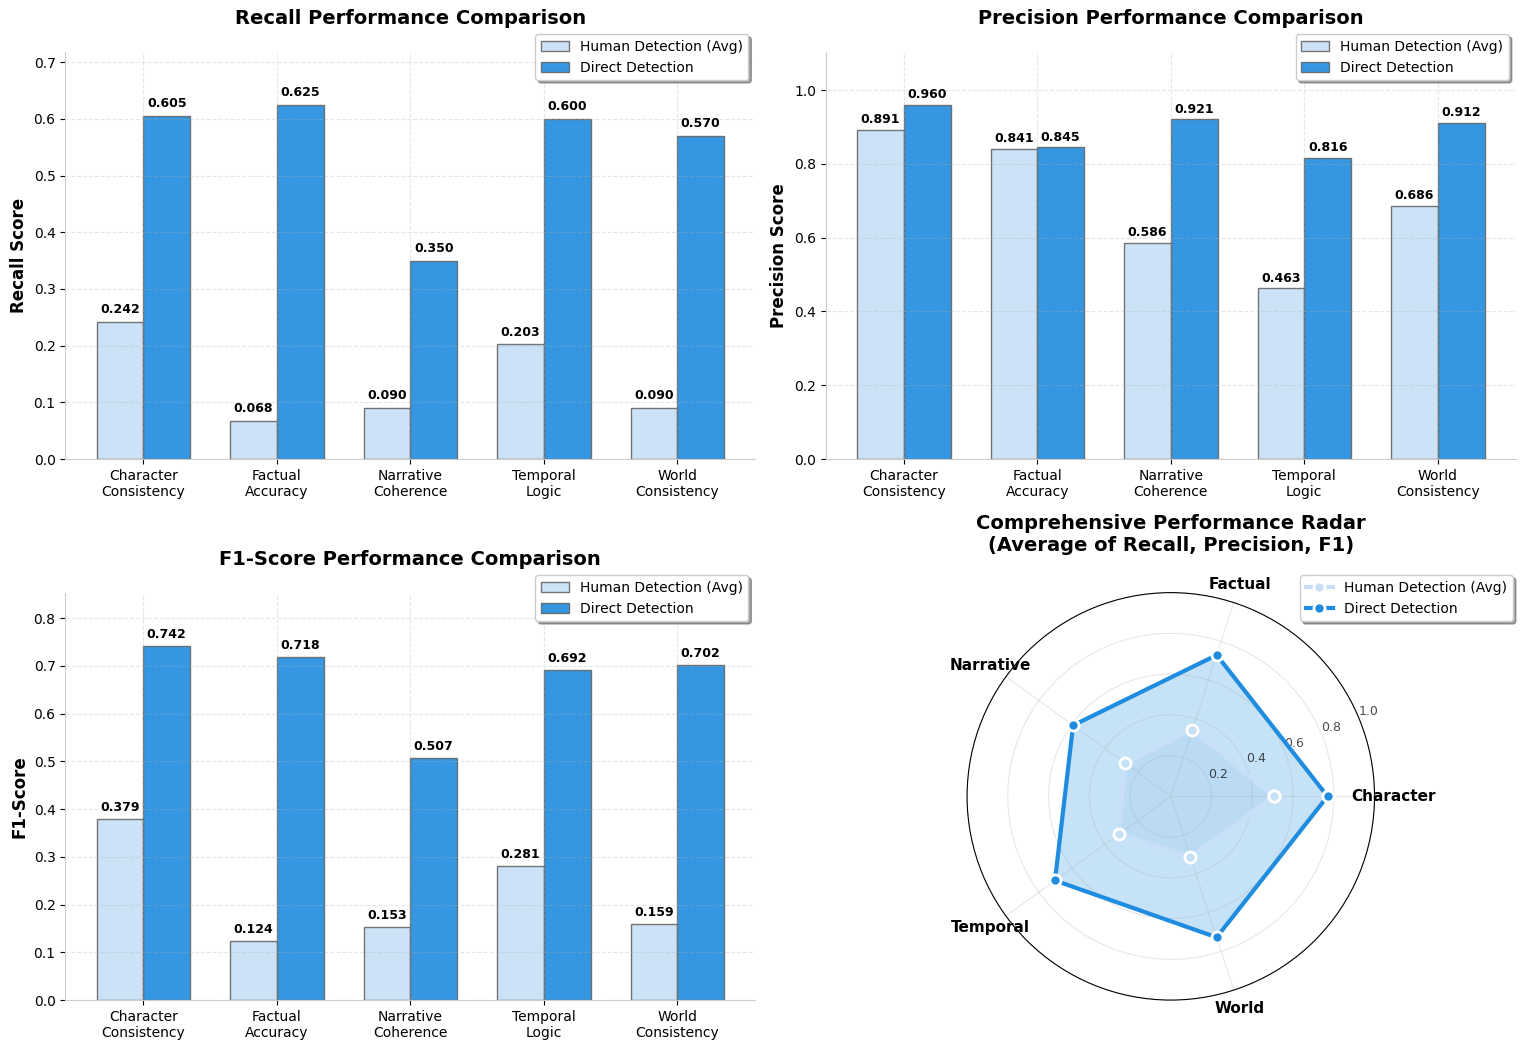
Figure fig:storyverify-performance: Performance comparison between ConStory-Checker and human expert judgment across five consistency error categories. The evaluation covers recall, precision, F1-score, and comprehensive radar visualization, demonstrating that our automated approach achieves human-competitive performance in detecting narrative inconsistencies.
Figure fig:storyverify-timeline: Complete judge prompt for Timeline & Plot Logic category in ConStory-Checker evaluation protocol.
Figure fig:storyverify-case: Complete judge prompt for Characterization category in ConStory-Checker evaluation protocol.
Figure fig:storyverify-world: Complete judge prompt for World-building & Setting category in ConStory-Checker evaluation protocol.
Figure fig:storyverify-factual: Complete judge prompt for Factual & Detail Consistency category in ConStory-Checker evaluation protocol.
Figure fig:storyverify-narrative: Complete judge prompt for Narrative & Style category in ConStory-Checker evaluation protocol.
Figure fig:storyverify-examples: Representative error detection examples by ConStory-Checker across five consistency dimensions: Timeline & Plot Logic, Characterization, World-building & Setting, Factual & Detail Consistency, and Narrative & Style. Each example demonstrates the system's ability to identify subtle contradictions through structured extraction of conflicting passages with precise location references.
Additional Evaluation Results
This section provides supplementary visualization and analysis supporting the experimental findings presented in Section sec:evaluation.
Model Performance Leaderboard
To facilitate intuitive comparison of model consistency performance across different families, Figure fig:leaderboard presents a comprehensive leaderboard visualization based on the Group Relative Rank (GRR) metric introduced in Section sec:rq1-benchmarks. This visualization complements the quantitative results reported in Table tab:comprehensive-performance by providing a visual ranking that emphasizes relative performance differences across model families. The visualization employs an inverted transformation of GRR values, where each model's performance score is computed as \(\text{score} = \max(\text{GRR}) - \text{GRR}_{\text{current}} + 1\) . Since lower GRR values indicate superior performance, this transformation ensures that models with smaller GRR values receive higher scores and correspondingly longer bars, providing an intuitive visual representation where bar height directly correlates with model superiority. Within each category---proprietary models, open-source models, capability-enhanced LLMs, and agent-enhanced systems---color intensity maps to relative score magnitude, with darker shades representing higher performance and lighter shades indicating lower performance. This gradient encoding enables rapid visual identification of top performers within each model family while maintaining clear cross-category comparisons. Figure fig:scatter-ced-length further illustrates the relationship between model consistency performance (CED) and average output length.
Table tab:task-type-ced further disaggregates consistency performance by prompt task type, reporting CED scores across the four task categories defined in Section sec:rq1-benchmarks: Generation (748 prompts), Continuation (429 prompts), Expansion (419 prompts), and Completion (394 prompts). Notably, Generation tasks consistently yield higher CED than other task types across most models, suggesting that open-ended story creation without prior context poses the greatest consistency challenge.
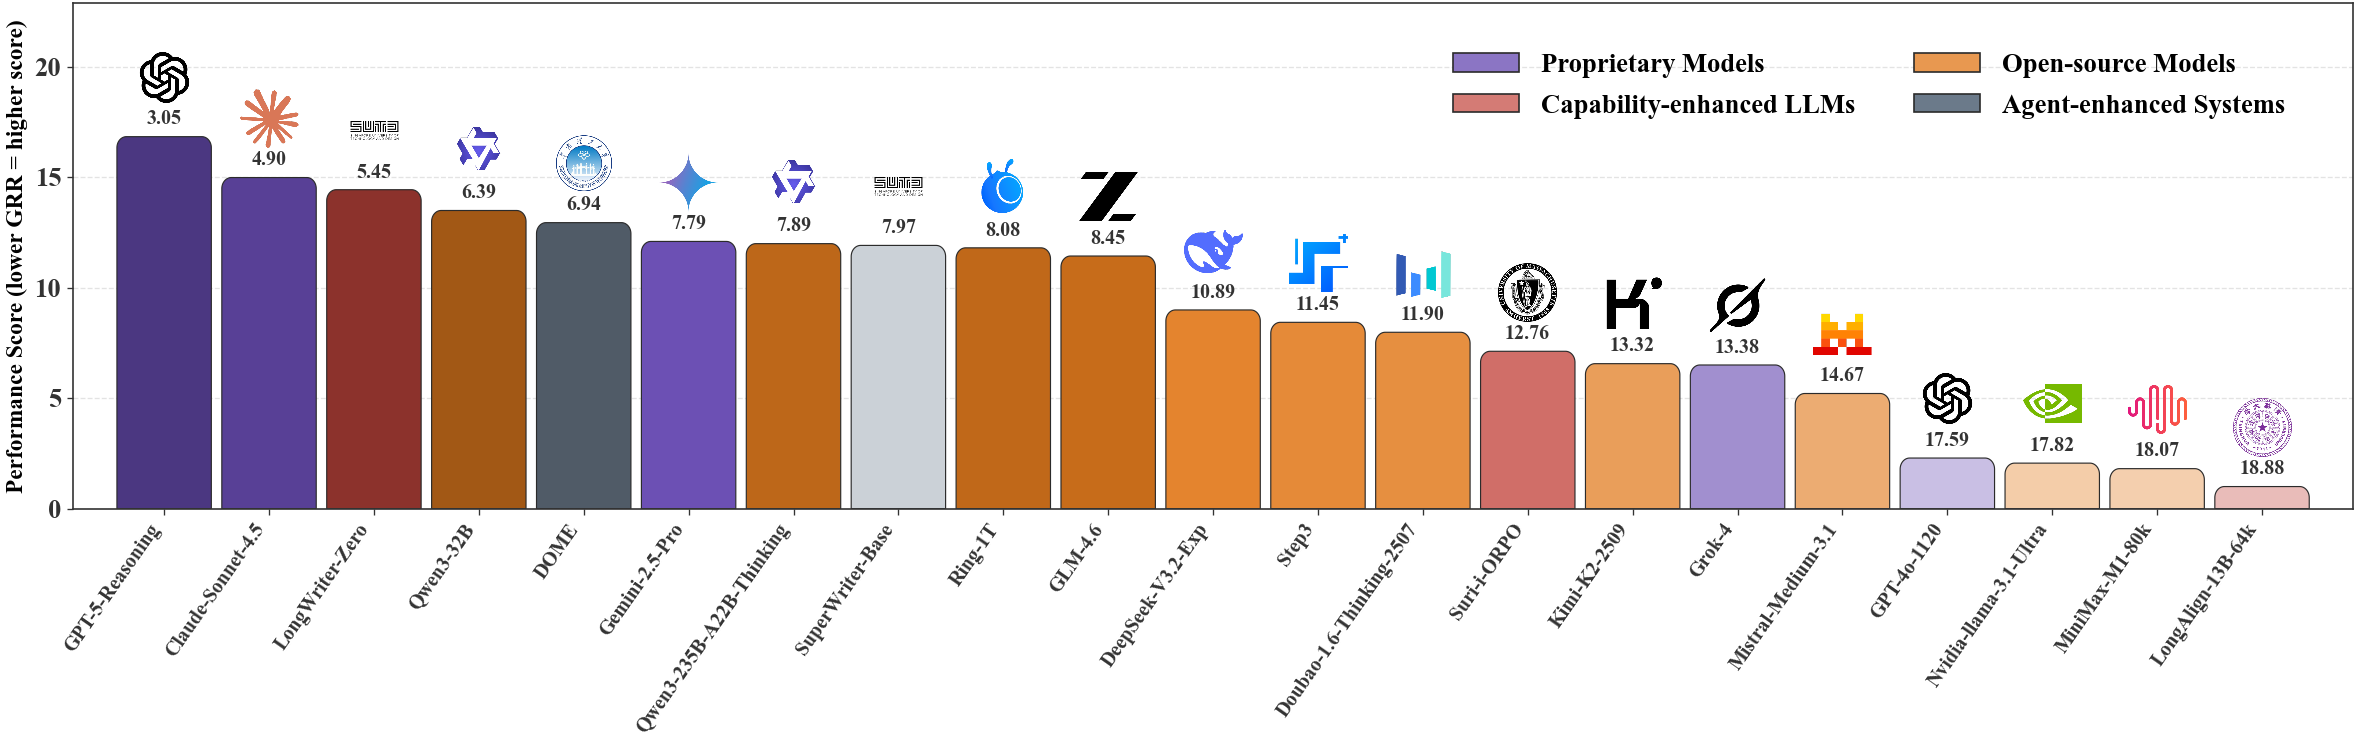
Figure fig:leaderboard: Performance leaderboard of evaluated models based on GRR scores. Bar length indicates relative performance (longer bars represent better consistency), with color intensity reflecting score magnitude within each model category. Models are grouped by family: proprietary (top), open-source, capability-enhanced LLMs, and agent-enhanced systems (bottom).
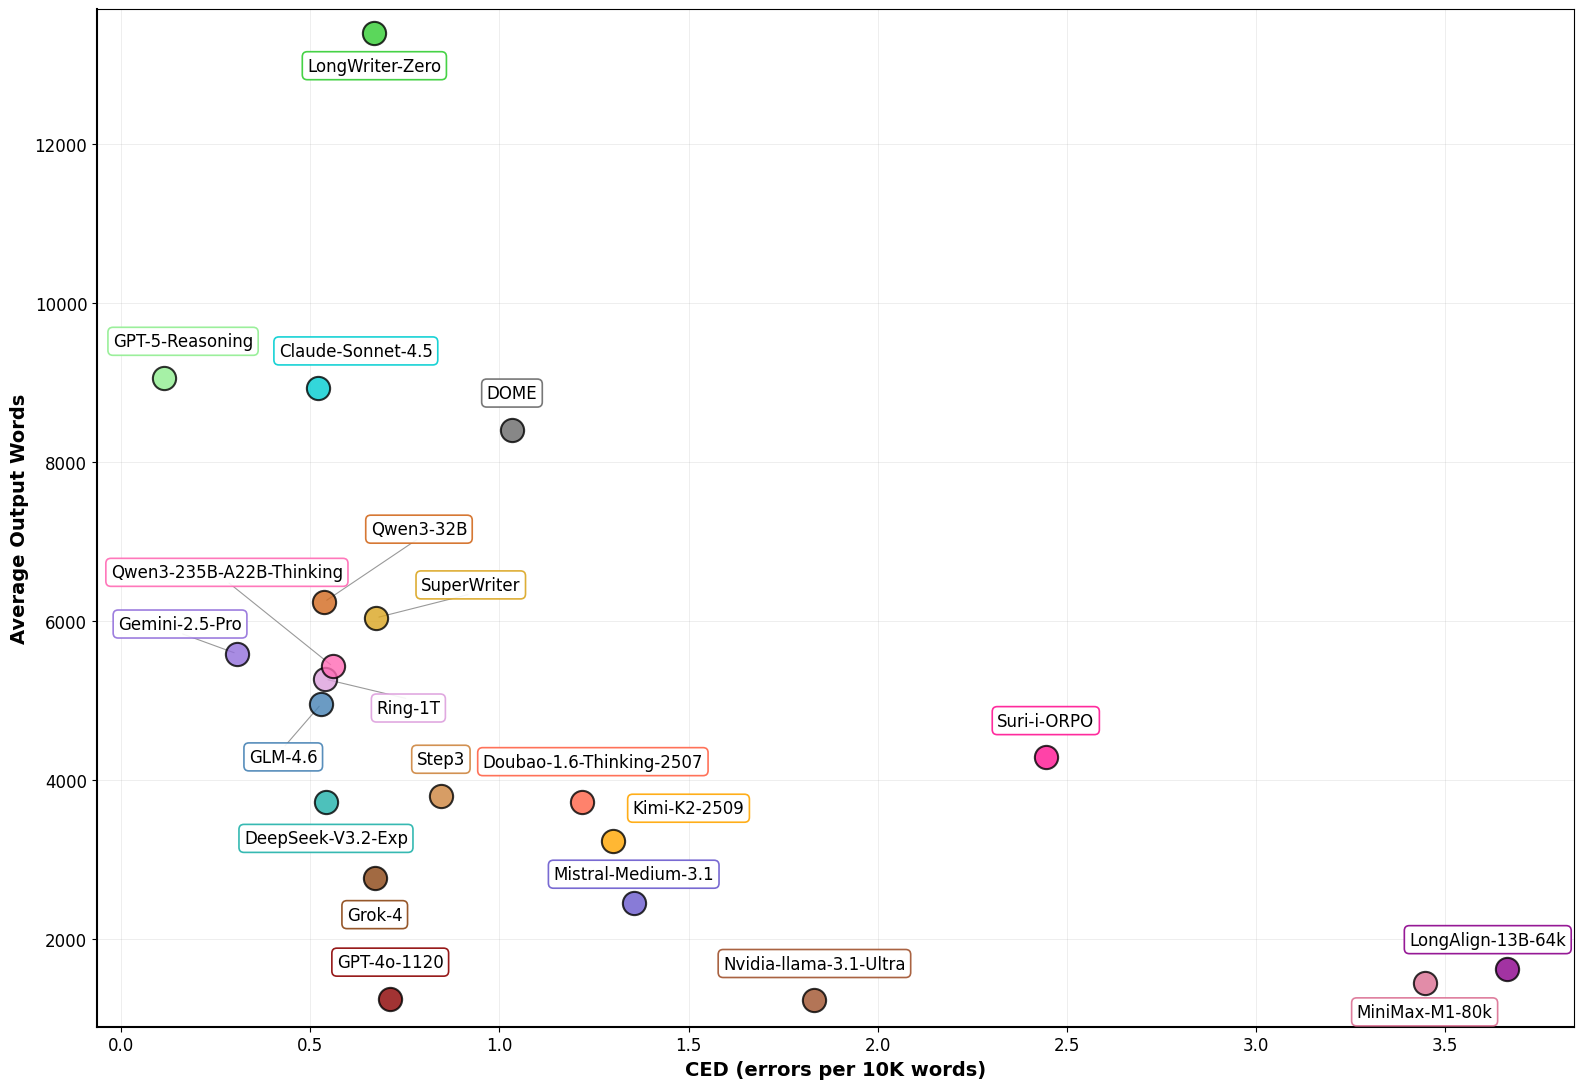
Figure fig:scatter-ced-length: The consistency performance (CED) of evaluated models versus average output words.
Table* tab:task-type-ced: Consistency Error Density (CED) disaggregated by prompt task type. CED: errors per 10K words (lower is better). Task type columns show CED for each category: Generation (open-ended story creation), Continuation (extending provided narratives), Expansion (elaborating specific segments), and Completion (filling removed spans). Numbers in parentheses denote the number of prompts per task type. Avg Words: average output length. Total: number of completed stories. Models are grouped by family and sorted by Overall CED in ascending order within each category. Bold values indicate the highest CED among the four task types for each model.
\begin{table*}[t!]
\centering
\small
\caption{Consistency Error Density (CED) disaggregated by prompt task type. \textbf{CED}: errors per 10K words (lower is better). Task type columns show CED for each category: \textbf{Generation} (open-ended story creation), \textbf{Continuation} (extending provided narratives), \textbf{Expansion} (elaborating specific segments), and \textbf{Completion} (filling removed spans). Numbers in parentheses denote the number of prompts per task type. \textbf{Avg Words}: average output length. \textbf{Total}: number of completed stories. Models are grouped by family and sorted by Overall CED in ascending order within each category. \textbf{Bold values} indicate the highest CED among the four task types for each model.}
\label{tab:task-type-ced}
\setlength{\tabcolsep}{3.5pt}
\renewcommand{1.15}{1.15}
\resizebox{\textwidth}{!}{
\begin{tabular}{l|c|c|c|c|c|c|c}
\toprule
\multirow{2}{*}{\textbf{Model}} & \multirow{2}{*}{\textbf{Overall CED}} & \textbf{Generation} & \textbf{Continuation} & \textbf{Expansion} & \textbf{Completion} & \multirow{2}{*}{\textbf{Avg Words}} & \multirow{2}{*}{\textbf{Total}} \\
& & \textbf{(748)} & \textbf{(429)} & \textbf{(419)} & \textbf{(394)} & & \\
\midrule
\multicolumn{8}{c}{\cellcolor[gray]{0.9}\textit{Proprietary Models}} \\
\midrule
GPT-5-Reasoning & 0.113 & 0.11 & 0.093 & 0.07 & \textbf{0.188} & 9050 & 1990 \\
Gemini-2.5-Pro & 0.302 & \textbf{0.379} & 0.233 & 0.277 & 0.257 & 5091 & 1996 \\
Gemini-2.5-Flash & 0.305 & 0.334 & 0.243 & 0.254 & \textbf{0.373} & 5504 & 1996 \\
Claude-Sonnet-4.5 & 0.52 & \textbf{0.67} & 0.387 & 0.498 & 0.402 & 8929 & 1998 \\
Grok-4 & 0.67 & \textbf{0.765} & 0.638 & 0.552 & 0.649 & 2765 & 2000 \\
GPT-4o-1120 & 0.711 & 0.776 & 0.389 & \textbf{0.912} & 0.708 & 1241 & 1774 \\
Doubao-1.6-Thinking-2507 & 1.217 & \textbf{1.415} & 1.154 & 1.084 & 1.054 & 3713 & 2000 \\
Mistral-Medium-3.1 & 1.355 & 1.376 & 0.931 & \textbf{2.02} & 1.069 & 2447 & 2000 \\
\midrule
\multicolumn{8}{c}{\cellcolor[gray]{0.9}\textit{Open-source Models}} \\
\midrule
GLM-4.6 & 0.528 & \textbf{0.785} & 0.311 & 0.381 & 0.437 & 4949 & 2000 \\
Qwen3-32B & 0.537 & \textbf{0.694} & 0.381 & 0.425 & 0.53 & 6237 & 2000 \\
Ring-1T & 0.539 & \textbf{0.641} & 0.484 & 0.489 & 0.461 & 5264 & 1999 \\
DeepSeek-V3.2-Exp & 0.541 & \textbf{0.795} & 0.325 & 0.382 & 0.465 & 3724 & 2000 \\
Qwen3-235B-A22B-Thinking & 0.559 & \textbf{0.605} & 0.44 & 0.575 & 0.586 & 5424 & 2000 \\
GLM-4.5 & 0.595 & 0.584 & 0.522 & \textbf{0.653} & 0.635 & 5421 & 2000 \\
Ling-1T & 0.699 & 0.72 & 0.597 & 0.613 & \textbf{0.862} & 5088 & 2000 \\
Step3 & 0.845 & 0.706 & 0.76 & 0.979 & \textbf{1.054} & 3793 & 1916 \\
Qwen3-Next-80B-Thinking & 0.959 & \textbf{1.15} & 0.913 & 0.778 & 0.846 & 4820 & 1973 \\
Kimi-K2-2509 & 1.3 & \textbf{1.686} & 0.926 & 1.162 & 1.112 & 3227 & 1792 \\
Kimi-K2-2507 & 1.33 & \textbf{1.775} & 0.933 & 1.109 & 1.152 & 3046 & 2000 \\
Qwen3-235B-A22B & 1.447 & 1.57 & 1.152 & \textbf{1.587} & 1.389 & 3246 & 2000 \\
Qwen3-Next-80B & 1.603 & \textbf{1.849} & 1.271 & 1.612 & 1.486 & 4013 & 2000 \\
Qwen3-4B-Instruct-2507 & 1.685 & 1.637 & 1.668 & \textbf{1.885} & 1.584 & 4919 & 1997 \\
Nvidia-llama-3.1-Ultra & 1.833 & \textbf{2.932} & 1.135 & 1.227 & 1.161 & 1224 & 1998 \\
Qwen3-30B-A3B-Instruct-2507 & 2.13 & \textbf{2.58} & 1.8 & 2.103 & 1.666 & 2968 & 2000 \\
DeepSeek-V3 & 2.422 & \textbf{3.18} & 2.102 & 2.001 & 1.781 & 670 & 2000 \\
QwenLong-L1-32B & 3.413 & \textbf{4.029} & 2.122 & 3.621 & 3.43 & 1234 & 2000 \\
DeepSeek-R1 & 3.419 & 3.007 & \textbf{3.829} & 3.737 & 3.415 & 680 & 1952 \\
MiniMax-M1-80k & 3.447 & 3.44 & 3.411 & \textbf{4.072} & 2.832 & 1442 & 1716 \\
\midrule
\multicolumn{8}{c}{\cellcolor[gray]{0.9}\textit{Capability-enhanced LLMs}} \\
\midrule
LongWriter-Zero-32B & 0.669 & \textbf{0.805} & 0.484 & 0.778 & 0.507 & 13393 & 1857 \\
Suri-i-ORPO & 2.445 & \textbf{2.768} & 2.117 & 2.355 & 2.284 & 4279 & 2000 \\
LongAlign-13B & 3.664 & \textbf{4.984} & 2.277 & 3.105 & 3.268 & 1624 & 2000 \\
\midrule
\multicolumn{8}{c}{\cellcolor[gray]{0.9}\textit{Agent-enhanced Systems}} \\
\midrule
SuperWriter & 0.674 & \textbf{0.75} & 0.632 & 0.673 & 0.576 & 6036 & 2000 \\
DOME & 1.033 & 1.108 & 0.912 & 0.94 & \textbf{1.122} & 8399 & 1969 \\
\bottomrule
\end{tabular}
}
\end{table*}
Output Length Distribution Statistics
Table tab:length-distribution-stats provides detailed statistics on generated story lengths, complementing the analysis in Section sec:rq2-length-dynamics. For each model, we report the number and percentage of stories in five length categories (0--1k, 1k--3k, 3k--5k, 5k--8k, and 8k+ words), along with average word count and total completed stories.
These statistics show clear differences in generation strategies. Proprietary models like GPT-5-Reasoning and Claude-Sonnet-4.5 prefer longer outputs (66.4% and 66.8% in the 8k+ category), while GPT-4o-1120 and Nvidia-llama-3.1-Ultra generate mostly shorter texts below 3k words (85.0% and 84.1%). Open-source models such as Qwen3-32B and GLM-4.6 show more balanced distributions across length bins. Combined with the error density metrics from Table tab:comprehensive-performance, these patterns highlight the trade-offs between generation length and consistency across different models.
Table* tab:length-distribution-stats: Detailed output length distribution across evaluated models. Columns show the number and percentage of stories in each word-count bin. Models are sorted by average word count in descending order.
\begin{table*}[t!]
\centering
\small
\caption{Detailed output length distribution across evaluated models. Columns show the number and percentage of stories in each word-count bin. Models are sorted by average word count in descending order.}
\label{tab:length-distribution-stats}
\setlength{\tabcolsep}{3.5pt}
\renewcommand{1.15}{1.15}
\resizebox{\textwidth}{!}{
\begin{tabular}{l|c|c|c|c|c|c|c}
\toprule
\textbf{Model} & \textbf{0--1k} & \textbf{1k--3k} & \textbf{3k--5k} & \textbf{5k--8k} & \textbf{8k+} & \textbf{Avg Words} & \textbf{Total} \\
\midrule
\multicolumn{8}{c}{\cellcolor[gray]{0.9}\textit{Proprietary Models}} \\
\midrule
GPT-5-Reasoning & 24 (1.2\%) & 48 (2.0\%) & 58 (2.5\%) & 554 (27.8\%) & 1322 (66.4\%) & 9050 & 1990 \\
Claude-Sonnet-4.5 & 54 (2.7\%) & 40 (2.0\%) & 39 (2.0\%) & 531 (26.6\%) & 1334 (66.8\%) & 8929 & 1998 \\
Gemini-2.5-Flash & 48 (2.4\%) & 75 (3.8\%) & 830 (41.6\%) & 838 (42.0\%) & 205 (10.3\%) & 5504 & 1996 \\
Gemini-2.5-Pro & 43 (2.2\%) & 43 (2.2\%) & 845 (42.3\%) & 1024 (51.3\%) & 41 (2.1\%) & 5091 & 1996 \\
Doubao-1.6-Thinking-2507 & 40 (2.0\%) & 548 (27.4\%) & 1129 (56.5\%) & 255 (12.8\%) & 28 (1.4\%) & 3713 & 2000 \\
Grok-4 & 78 (3.9\%) & 1326 (66.3\%) & 542 (27.1\%) & 53 (2.6\%) & 1 (0.1\%) & 2765 & 2000 \\
Mistral-Medium-3.1 & 73 (3.6\%) & 1524 (76.2\%) & 380 (19.0\%) & 18 (0.9\%) & 5 (0.2\%) & 2447 & 2000 \\
GPT-4o-1120 & 196 (11.0\%) & 1578 (85.0\%) & 0 (0.0\%) & 0 (0.0\%) & 0 (0.0\%) & 1241 & 1774 \\
\midrule
\multicolumn{8}{c}{\cellcolor[gray]{0.9}\textit{Open-source Models}} \\
\midrule
Qwen3-32B & 48 (2.4\%) & 59 (2.9\%) & 21 (1.1\%) & 1872 (93.6\%) & 0 (0.0\%) & 6237 & 2000 \\
Qwen3-235B-A22B-Thinking & 60 (3.0\%) & 45 (2.2\%) & 174 (8.7\%) & 1721 (86.1\%) & 0 (0.0\%) & 5424 & 2000 \\
GLM-4.5 & 56 (2.8\%) & 177 (8.8\%) & 776 (38.8\%) & 698 (34.9\%) & 293 (14.6\%) & 5421 & 2000 \\
Ring-1T & 46 (2.3\%) & 48 (2.4\%) & 784 (39.2\%) & 1022 (51.1\%) & 99 (5.0\%) & 5264 & 1999 \\
Ling-1T & 45 (2.2\%) & 176 (8.8\%) & 892 (44.6\%) & 710 (35.5\%) & 177 (8.8\%) & 5088 & 2000 \\
GLM-4.6 & 49 (2.5\%) & 72 (3.6\%) & 953 (47.6\%) & 866 (43.3\%) & 60 (3.0\%) & 4949 & 2000 \\
Qwen3-4B-Instruct-2507 & 66 (3.3\%) & 35 (1.8\%) & 1188 (59.5\%) & 662 (33.1\%) & 46 (2.3\%) & 4919 & 1997 \\
Qwen3-Next-80B-Thinking & 80 (4.1\%) & 478 (24.2\%) & 951 (48.2\%) & 242 (12.3\%) & 222 (11.3\%) & 4828 & 1973 \\
Qwen3-Next-80B & 59 (2.9\%) & 114 (5.7\%) & 1632 (81.6\%) & 182 (9.1\%) & 13 (0.7\%) & 4013 & 2000 \\
Step3 & 45 (2.3\%) & 458 (23.9\%) & 1115 (58.2\%) & 272 (14.2\%) & 26 (1.4\%) & 3793 & 1916 \\
DeepSeek-V3.2-Exp & 50 (2.5\%) & 487 (24.3\%) & 1311 (65.5\%) & 227 (11.3\%) & 5 (0.2\%) & 3724 & 2000 \\
Qwen3-235B-A22B & 68 (3.4\%) & 353 (17.6\%) & 1576 (78.8\%) & 3 (0.1\%) & 0 (0.0\%) & 3246 & 2000 \\
Kimi-K2-2509 & 153 (8.5\%) & 771 (43.0\%) & 663 (37.0\%) & 138 (7.7\%) & 67 (3.7\%) & 3227 & 1792 \\
Kimi-K2-2507 & 69 (3.5\%) & 928 (46.4\%) & 948 (47.4\%) & 55 (2.8\%) & 0 (0.0\%) & 3046 & 2000 \\
Qwen3-30B-A3B-Instruct-2507 & 55 (2.8\%) & 948 (47.4\%) & 991 (49.5\%) & 1 (0.1\%) & 5 (0.2\%) & 2968 & 2000 \\
MiniMax-M1-80k & 694 (40.4\%) & 935 (54.5\%) & 11 (0.6\%) & 44 (2.6\%) & 32 (1.9\%) & 1442 & 1716 \\
DeepSeek-R1 & 108 (5.1\%) & 1852 (94.9\%) & 0 (0.0\%) & 0 (0.0\%) & 0 (0.0\%) & 1391 & 1952 \\
QwenLong-L1-32B & 792 (39.6\%) & 1188 (59.4\%) & 25 (1.2\%) & 2 (0.1\%) & 1 (0.1\%) & 1234 & 2000 \\
Nvidia-llama-3.1-Ultra & 317 (15.9\%) & 1681 (84.1\%) & 0 (0.0\%) & 0 (0.0\%) & 0 (0.0\%) & 1224 & 1998 \\
DeepSeek-V3 & 1971 (98.6\%) & 29 (1.5\%) & 0 (0.0\%) & 0 (0.0\%) & 0 (0.0\%) & 678 & 2000 \\
\midrule
\multicolumn{8}{c}{\cellcolor[gray]{0.9}\textit{Capability-enhanced LLMs}} \\
\midrule
LongWriter-Zero-32B & 58 (2.9\%) & 312 (15.7\%) & 188 (9.5\%) & 79 (4.0\%) & 1350 (67.9\%) & 13241 & 1987 \\
Suri-i-ORPO & 170 (8.5\%) & 840 (42.0\%) & 418 (20.9\%) & 228 (11.4\%) & 344 (17.2\%) & 4279 & 2000 \\
LongAlign-13B & 1812 (90.6\%) & 69 (3.5\%) & 0 (0.0\%) & 1 (0.1\%) & 118 (5.9\%) & 1624 & 2000 \\
\midrule
\multicolumn{8}{c}{\cellcolor[gray]{0.9}\textit{Agent-enhanced Systems}} \\
\midrule
DOME & 2 (0.1\%) & 4 (0.2\%) & 81 (4.1\%) & 536 (27.2\%) & 1346 (68.4\%) & 8399 & 1969 \\
SuperWriter & 59 (2.9\%) & 144 (7.2\%) & 378 (18.9\%) & 1069 (53.4\%) & 350 (17.5\%) & 6036 & 2000 \\
\bottomrule
\end{tabular}
}
\end{table*}
Token-Level Uncertainty Metrics
Extending the entropy analysis presented in Section sec:rq3-entropy, this subsection provides comprehensive token-level uncertainty measurements across three complementary metrics: Shannon entropy, token probability, and perplexity. While Section sec:rq3-entropy demonstrated that error-bearing segments exhibit higher entropy than the whole-text baseline, a multi-metric analysis offers deeper insights into the probabilistic characteristics underlying consistency failures.
Metric Definitions.
For each token position \(t\) in a generated sequence, we compute three uncertainty measures from the model's output distribution. Shannon Entropy is defined in Section sec:rq3-entropy. Token Probability measures the model's confidence in the selected token \(w_t\) , computed as \(p_t = \exp(\log p(w_t | w_{<t}))\) , where higher values indicate stronger confidence. Perplexity captures the model's surprise at the observed token sequence, calculated as the exponential of average negative log-probability:
with lower perplexity indicating more predictable sequences. For text segments \(S\) with \(N\) tokens, we report segment-level averages: \(\bar{p}(S) = \frac{1}{N}\sum_{t=1}^{N} p_t\) , and \(\overline{\text{PPL}}(S) = \frac{1}{N}\sum_{t=1}^{N} \frac{1}{p_t}\) .
Results.
Table tab:token-uncertainty-comparison presents comprehensive comparisons across all three metrics for two representative models. The results reveal consistent patterns: error content consistently exhibits higher uncertainty (elevated entropy and perplexity) and lower confidence (reduced probability) compared to the whole-text baseline. For Qwen3-30B-A3B-Instruct-2507, error segments show +12.03% higher entropy, -5.41% lower probability, and +2.54% higher perplexity relative to whole text, while Qwen3-4B-Instruct-2507 demonstrates even stronger divergence (+19.24%, -7.99%, +5.55% respectively). These converging signals across all three metrics indicate that consistency failures emerge precisely in regions where the model exhibits elevated uncertainty and diminished confidence, suggesting that token-level uncertainty provides a reliable early warning signal for potential narrative inconsistencies during generation.
Table* tab:token-uncertainty-comparison: Comprehensive token-level uncertainty comparison across three metrics. Each metric compares error-bearing segments against the whole-text baseline. Higher entropy and perplexity, along with lower probability, indicate greater model uncertainty. Relative differences show the percentage change of error content compared to whole text.
\begin{table*}[t!]
\centering
\small
\caption{Comprehensive token-level uncertainty comparison across three metrics. Each metric compares error-bearing segments against the whole-text baseline. Higher entropy and perplexity, along with lower probability, indicate greater model uncertainty. Relative differences show the percentage change of error content compared to whole text.}
\label{tab:token-uncertainty-comparison}
\setlength{\tabcolsep}{6pt}
\renewcommand{1.15}{1.2}
\begin{tabular}{l|cc|c}
\toprule
\multirow{2}{*}{\textbf{Model}} & \multicolumn{2}{c|}{\textbf{Average Values}} & \textbf{Relative Difference} \\
\cmidrule(lr){2-3} \cmidrule(lr){4-4}
& \textbf{Whole Text} & \textbf{Error Content} & \textbf{(Error vs Whole)} \\
\midrule
\multicolumn{4}{c}{\cellcolor[gray]{0.9}\textit{Entropy (bits) --- Higher indicates greater uncertainty}} \\
\midrule
Qwen3-30B-A3B-Instruct-2507 & 1.1438 & 1.2814 & \textbf{\textcolor{red!70!black}{+12.03\%}} \\
Qwen3-4B-Instruct-2507 & 1.0734 & 1.2799 & \textbf{\textcolor{red!70!black}{+19.24\%}} \\
\midrule
\multicolumn{4}{c}{\cellcolor[gray]{0.9}\textit{Probability --- Higher indicates greater confidence}} \\
\midrule
Qwen3-30B-A3B-Instruct-2507 & 0.6895 & 0.6522 & \textbf{\textcolor{green!50!black}{-5.41\%}} \\
Qwen3-4B-Instruct-2507 & 0.7097 & 0.6530 & \textbf{\textcolor{green!50!black}{-7.99\%}} \\
\midrule
\multicolumn{4}{c}{\cellcolor[gray]{0.9}\textit{Perplexity --- Lower indicates better predictability}} \\
\midrule
Qwen3-30B-A3B-Instruct-2507 & 1.8875 & 1.9354 & \textbf{\textcolor{red!70!black}{+2.54\%}} \\
Qwen3-4B-Instruct-2507 & 1.8566 & 1.9596 & \textbf{\textcolor{red!70!black}{+5.55\%}} \\
\bottomrule
\end{tabular}
\end{table*}
Model-Specific Error Correlations
Figure fig:model-error-correlations shows model-specific correlation matrices for eight representative models, extending the analysis in Section sec:rq4-correlations. Proprietary models (GPT-5-Reasoning, Gemini-2.5-Pro) have sparse matrices with weak cross-category dependencies, while Claude-Sonnet-4.5 shows stronger Fact.--World (r=0.387) and Narr.--Fact. (r=0.429) correlations. Among open-source models, GLM-4.6 and Kimi-K2-2509 show the strongest Char.--Fact. correlations (r=0.533 and r=0.556, respectively).
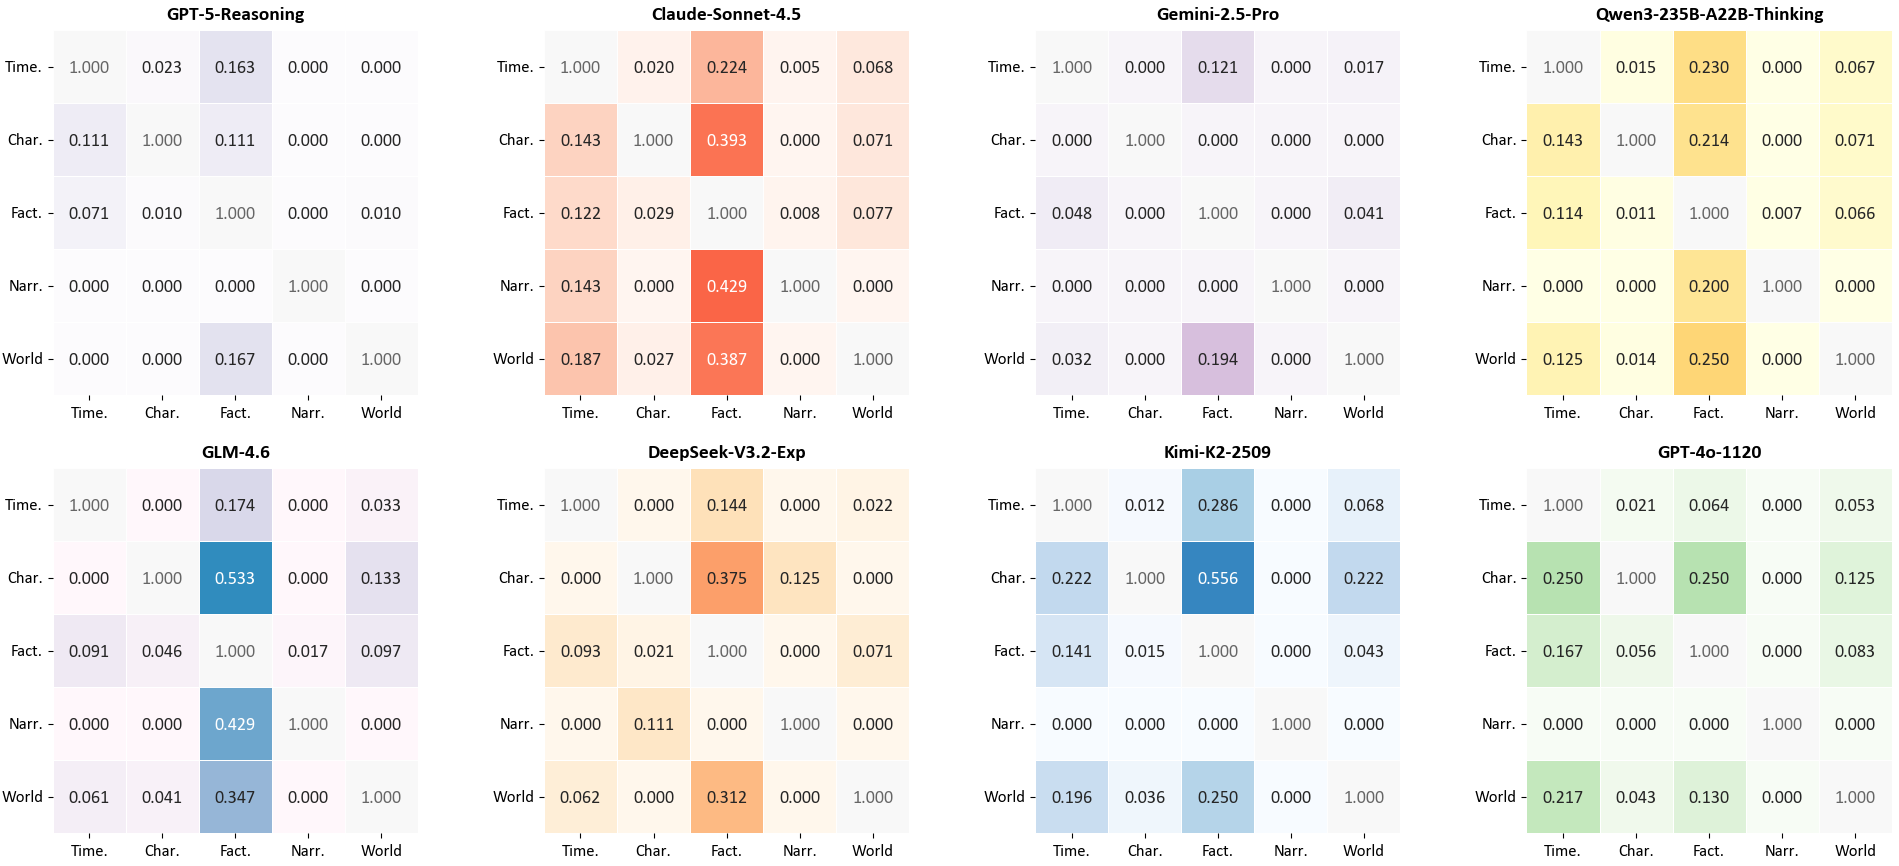
Figure fig:model-error-correlations: Model-specific error correlation matrices across eight representative models. Darker colors indicate stronger positive correlations between error categories.
Extended Positional Analysis
Table tab:extended-error-position extends the positional analysis presented in Section sec:rq5-positions by providing per-model statistics for eight representative models. The extended analysis confirms that the positional patterns observed in the main text---fact positions clustering in the early-to-mid narrative (15--30%) and contradiction positions extending toward later sections (40--60%)---hold consistently across diverse model architectures. In the table, .741,.843,.933blue highlights the largest Gap values per error type.
Table* tab:extended-error-position: Per-model positional distribution of seven representative error subtypes across eight models. Positions are normalized by story length (0--100%). Fact: average position where facts are first established; Contra: average position where contradictions appear; Gap: average distance between fact and contradiction positions, computed as \(Avg Gap = 1n_i=1^n|contra_i - fact_i|\) . .741,.843,.933Blue = largest Gap per error type.
\begin{table*}[t!]
\centering
\small
\setlength{\tabcolsep}{3pt}
\renewcommand{1.15}{1.15}
\caption{Per-model positional distribution of seven representative error subtypes across eight models. Positions are normalized by story length (0--100\%). \textbf{Fact}: average position where facts are first established; \textbf{Contra}: average position where contradictions appear; \textbf{Gap}: average distance between fact and contradiction positions, computed as $\text{Avg Gap} = \frac{1}{n}\sum_{i=1}^{n}|\text{contra}_i - \text{fact}_i|$. \colorbox[rgb]{.741,.843,.933}{\textbf{Blue}} = largest Gap per error type.}
\label{tab:extended-error-position}
\resizebox{\textwidth}{!}{
\begin{tabular}{ll ccccccc}
\toprule
\multirow{2}{*}{\textbf{Model}} & \multirow{2}{*}{\textbf{Metric}} & \textbf{Absolute Time} & \textbf{Core Rules} & \textbf{Quantitative} & \textbf{Geographical} & \textbf{Nomenclature} & \textbf{Memory} & \textbf{Perspective} \\
& & \textbf{Contradictions} & \textbf{Violations} & \textbf{Mismatches} & \textbf{Contradictions} & \textbf{Confusions} & \textbf{Contradictions} & \textbf{Confusions} \\
\midrule
\rowcolor[gray]{0.95}
\multicolumn{9}{c}{\textit{Proprietary Models}} \\
\midrule
\multirow{3}{*}{GPT-5-Reasoning}
& Fact   & 48.4\% & 21.8\% & 20.0\% & 7.7\% & 20.2\% & 21.4\% & 13.3\% \\
& Contra & 90.6\% & 21.1\% & 32.2\% & 30.2\% & 38.1\% & 40.5\% & 4.3\% \\
& Gap    & \cellcolor[rgb]{.741,.843,.933}\textbf{47.7\%} & 0.8\% & 12.7\% & 22.6\% & 24.2\% & 19.1\% & \cellcolor[rgb]{.741,.843,.933}\textbf{15.8\%} \\
\midrule
\multirow{3}{*}{Claude-Sonnet-4.5}
& Fact   & 23.1\% & 19.1\% & 25.7\% & 12.2\% & 18.6\% & 16.3\% & 35.7\% \\
& Contra & 41.5\% & 43.1\% & 43.4\% & 32.0\% & 37.7\% & 34.5\% & 35.9\% \\
& Gap    & 33.3\% & 28.1\% & 25.0\% & 21.3\% & \cellcolor[rgb]{.741,.843,.933}\textbf{29.1\%} & 19.7\% & 1.0\% \\
\midrule
\multirow{3}{*}{Gemini-2.5-Pro}
& Fact   & 19.3\% & 12.9\% & 21.1\% & 14.4\% & 17.7\% & 28.7\% & 0.2\% \\
& Contra & 38.3\% & 39.8\% & 44.5\% & 41.9\% & 30.1\% & 29.5\% & 1.7\% \\
& Gap    & 19.0\% & 27.0\% & \cellcolor[rgb]{.741,.843,.933}\textbf{28.6\%} & 28.2\% & 18.8\% & 1.9\% & 1.5\% \\
\midrule
\multirow{3}{*}{GPT-4o-1120}
& Fact   & 13.7\% & 42.9\% & 33.9\% & 31.7\% & 11.0\% & 13.7\% & 23.9\% \\
& Contra & 52.9\% & 55.8\% & 41.0\% & 51.2\% & 30.2\% & 46.3\% & 15.5\% \\
& Gap    & 39.2\% & \cellcolor[rgb]{.741,.843,.933}\textbf{37.6\%} & 26.8\% & \cellcolor[rgb]{.741,.843,.933}\textbf{44.5\%} & 19.2\% & 32.5\% & 11.4\% \\
\midrule
\rowcolor[gray]{0.95}
\multicolumn{9}{c}{\textit{Open-source Models}} \\
\midrule
\multirow{3}{*}{\shortstack[l]{Qwen3-235B\\-A22B-Thinking}}
& Fact   & 16.4\% & 24.6\% & 18.5\% & 19.2\% & 19.4\% & 12.5\% & 28.4\% \\
& Contra & 36.6\% & 37.0\% & 35.6\% & 34.9\% & 37.3\% & 32.0\% & 27.4\% \\
& Gap    & 20.2\% & 23.5\% & 21.7\% & 19.4\% & 23.5\% & 26.3\% & 3.3\% \\
\midrule
\multirow{3}{*}{GLM-4.6}
& Fact   & 17.7\% & 16.6\% & 21.0\% & 24.9\% & 22.3\% & 29.4\% & 0.1\% \\
& Contra & 45.7\% & 36.8\% & 40.6\% & 45.3\% & 32.8\% & 33.7\% & 1.3\% \\
& Gap    & 28.0\% & 26.6\% & 25.5\% & 41.7\% & 27.0\% & 22.2\% & 1.2\% \\
\midrule
\multirow{3}{*}{DeepSeek-V3.2-Exp}
& Fact   & 15.1\% & 25.0\% & 23.8\% & 30.7\% & 25.3\% & 29.3\% & 0.4\% \\
& Contra & 36.3\% & 42.5\% & 41.3\% & 31.7\% & 31.1\% & 46.6\% & 1.7\% \\
& Gap    & 21.8\% & 17.5\% & 23.7\% & 37.4\% & 21.4\% & \cellcolor[rgb]{.741,.843,.933}\textbf{56.4\%} & 1.4\% \\
\midrule
\multirow{3}{*}{Kimi-K2-2509}
& Fact   & 26.8\% & 26.6\% & 23.5\% & 22.3\% & 38.1\% & 23.1\% & 7.4\% \\
& Contra & 49.3\% & 38.7\% & 46.3\% & 46.1\% & 38.4\% & 42.4\% & 9.6\% \\
& Gap    & 28.3\% & 26.5\% & 26.6\% & 33.2\% & 23.5\% & 25.0\% & 2.4\% \\
\bottomrule
\end{tabular}
}
\end{table*}
Explanation of Metrics
Example Calculation
We illustrate CED and GRR computation with examples demonstrating their complementary roles.
CED Calculation.
Consider models generating stories:
Table:
\begin{table}[h]
\centering
\small
\setlength{\tabcolsep}{10pt}
\begin{tabular}{lrr}
\toprule
& \textbf{Words} & \textbf{Errors} \\
\midrule
Story 1 & 8,000 & 2 \\
Story 2 & 10,000 & 3 \\
Story 3 & 6,000 & 1 \\
Story 4 & 8,000 & 0 \\
Story 5 & 800 & 0 \\
\midrule
\textbf{Total (1--5)} & \textbf{32,800} & \textbf{6} \\
\bottomrule
\end{tabular}
\end{table}
For Stories 1--5, overall CED normalizes total errors by total words (per 10K): [ CED_overall = 632,800 / 10,000 = 63.28 1.83 ]
Category CED: If errors are 1 Char., 1 Fact., 1 Narr., 2 Time., 1 World: [ CED_Time = 23.28 0.61, CED_Char = 13.28 0.30 ]
However, Stories 4 and 5 both have zero errors, yielding identical CED=0.00, yet Story 4 generates 8,000 words while Story 5 generates only 800 words—a 10-fold difference in narrative completeness that CED cannot capture.
GRR Calculation.
To address this, GRR ranks models within each story using the quality score from Equation eq:quality-rq1. For Stories 4 and 5: [ Q_4 = 8,0001+0 = 8,000, Q_5 = 8001+0 = 800 ]
Story 4 ranks higher (rank 1) than Story 5 (rank 2) despite identical CED. GRR then averages these ranks across all stories following Equation eq:grr-rq1, where lower values indicate better performance.
Interpretation.
In Table tab:comprehensive-performance: CED reports absolute error density (errors per 10K words); GRR provides relative ranking that accounts for both consistency and completeness, addressing CED's inability to differentiate models when error densities are identical.